
B2B Conversion Rate: Benchmarks by Industry, Stage and Channel
See B2B conversion rate benchmarks for 2026: 24 industries, five funnel stages, organic vs paid. Get the formulas and the levers that move the number.


Your team generates leads, your reps are prospecting, yet the numbers don't follow. The problem is rarely volume. It's your B2B conversion rate: in 23 of the 24 industries tracked in First Page Sage's 2026 report, websites convert between 1.1 and 3.1 percent of their visitors. Roughly 97 visitors out of 100 leave without doing anything.
This guide gives the benchmarks by industry, funnel stage and channel, each with its source, the formulas to compute your own, and the levers that move each number. Starting with the one most teams skip: the quality of the data behind every lead.
What Is B2B Conversion Rate and How to Calculate It
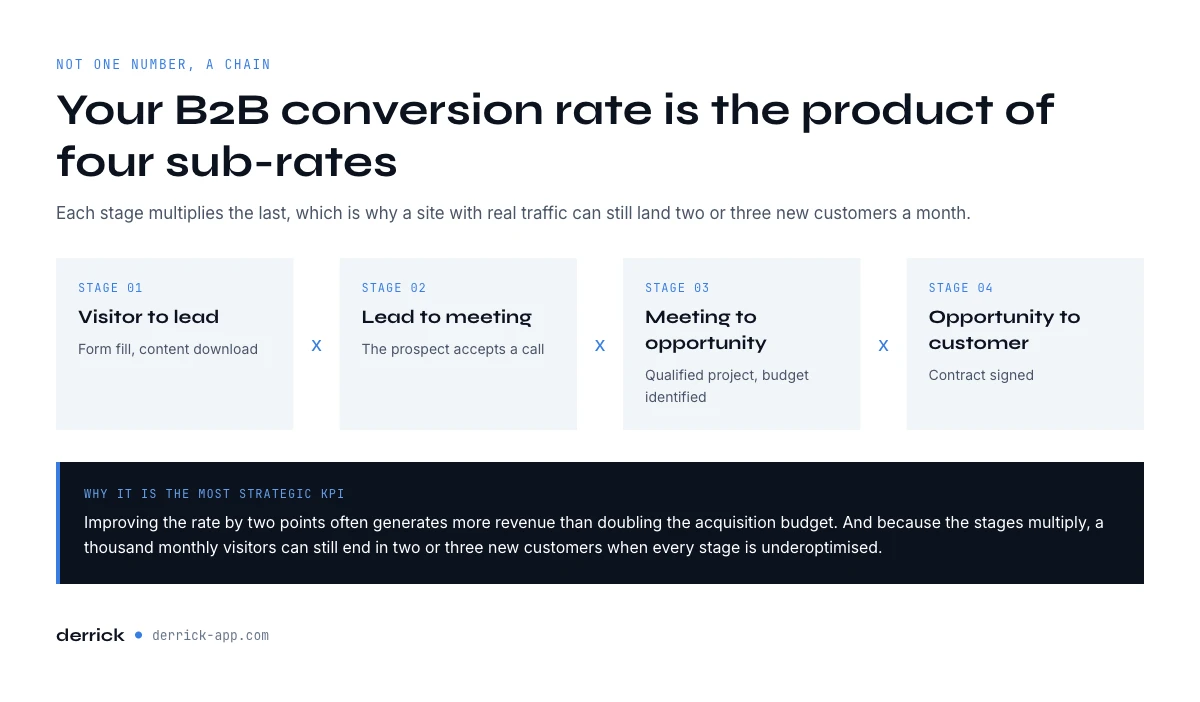
B2B conversion rate measures the percentage of prospects who complete a defined step in your sales funnel. It's not a single number. It's a chain of rates, one per step, and each one has its own formula.
In B2B prospecting, most teams track four key conversion stages:
| Stage | Definition | Formula |
|---|---|---|
| Visitor → Lead | Form fill, content download | leads ÷ unique visitors × 100 |
| Lead → Meeting | Prospect accepts a sales call | meetings ÷ leads × 100 |
| Meeting → Opportunity | Qualified project, budget identified | opportunities ÷ meetings × 100 |
| Opportunity → Customer | Contract signed | deals won ÷ opportunities × 100 |
The benchmarks for each step come further down, with their sources: by industry, by funnel stage and by channel.
Your overall conversion rate is the product of all these sub-rates. A company generating 1,000 monthly website visitors can end up with just 2 or 3 new customers if each stage is underoptimized.
Why is this the most strategic growth KPI? Because improving your conversion rate by two points often generates more revenue than doubling your acquisition budget. Let's look at what actually makes it move.
Sales conversion rate: definition and formula
The sales conversion rate is the share of sales opportunities that turn into signed customers. Formula: deals won ÷ opportunities worked over the same period × 100. Twelve deals won from 40 opportunities in a quarter gives 30 percent.
It sits at the bottom of the funnel, so it reads very differently from a site-wide rate. In First Page Sage's B2B SaaS funnel benchmarks (updated June 2025), opportunity to close runs from 31 percent when you sell to enterprises to 46 percent when you sell to small companies, and from 32 to 40 percent depending on the acquisition channel. Measured one step earlier, from SQL to signed deal, the same data gives about 16 percent for mid-sized targets: 42 percent from SQL to opportunity, then 39 percent to close.
Teams that sell by phone also track a sales call conversion rate: meetings booked ÷ calls connected × 100. We haven't found a published cross-industry benchmark for it that we would stand behind, so set your own baseline over four weeks before you try to move it.
What is a good B2B conversion rate? The 2026 benchmarks by industry
A good B2B conversion rate is between 1 and 3 percent of website visitors for most sectors, with legal services the clear outlier at 7.4 percent and B2B SaaS at the bottom of the range at 1.1 percent.
That single sentence answers the question most people arrive with, and it is also the reason a raw percentage means nothing without a sector attached. Below are the conversion rates by industry from First Page Sage's report B2B Conversion Rates By Industry, 2026, defined as the share of unique website visitors who complete a conversion action, sorted from highest to lowest.
| Industry | B2B conversion rate (2026) |
|---|---|
| Legal services | 7.4 percent |
| HVAC services | 3.1 percent |
| Staffing and recruiting | 2.9 percent |
| Higher education | 2.8 percent |
| Real estate | 2.7 percent |
| Industrial IoT | 2.6 percent |
| Oil and gas | 2.5 percent |
| PCB design and manufacturing | 2.4 percent |
| Manufacturing | 2.2 percent |
| Addiction treatment | 2.1 percent |
| Construction | 1.9 percent |
| Financial services | 1.9 percent |
| Pharmaceutical | 1.9 percent |
| Biotech | 1.8 percent |
| Solar energy | 1.8 percent |
| Commercial insurance | 1.7 percent |
| Heavy equipment | 1.7 percent |
| Medical device | 1.6 percent |
| IT and managed services | 1.5 percent |
| Transportation and logistics | 1.4 percent |
| Environmental services | 1.3 percent |
| Engineering | 1.2 percent |
| B2B SaaS | 1.1 percent |
| Software development | 1.1 percent |
Source: First Page Sage, 2026 industry conversion report (Evan Bailyn, published September 18, 2025, last updated December 23, 2025). Conversion rates by industry, measured on unique website visitors. Use them to place yourself in a band, not to set a target: your deal size and your sales cycle move this number more than any single optimisation.
The spread here is narrower than it looks. Strip out legal services and 23 of the 24 sectors sit between 1.1 and 3.1 percent, which is a factor of three, against a factor of ten on cost per lead. Conversion rate is a much flatter metric than acquisition cost, and that has a practical consequence: doubling your rate is genuinely hard, while halving what you pay for the visitors who convert is often a data problem you can fix in a week.
One warning before you compare yourself with figures found elsewhere: many "average conversion rate" numbers mix in ecommerce, where a visitor can buy in a single session. A B2B purchase usually goes through several people, a budget cycle and at least one sales conversation, so what the website counts as a conversion is a form fill or a demo request, not a sale. Comparing that with a store's checkout rate tells you nothing. Compare B2B with B2B, and stage with stage.
B2B conversion rate by funnel stage: where the pipeline actually leaks
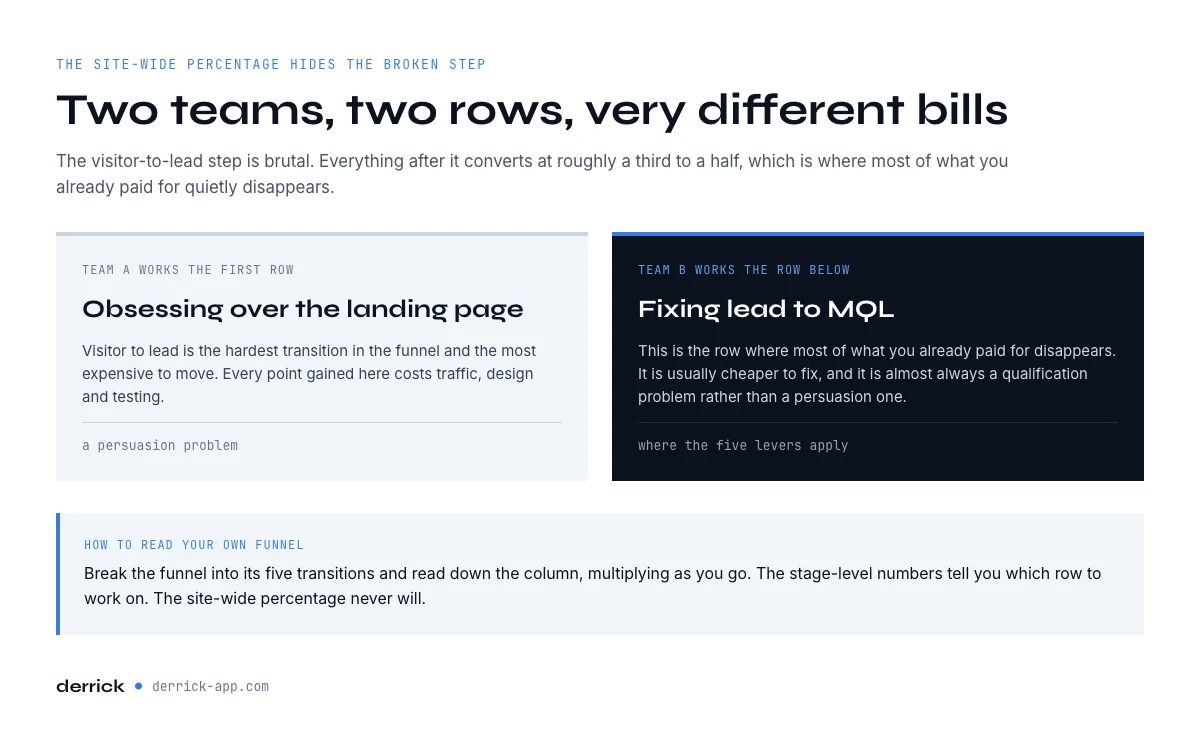
The site-wide percentage hides which step is broken. First Page Sage's B2B SaaS Funnel Conversion Benchmarks (updated June 2025, built on more than 50 B2B SaaS clients) break the funnel into five transitions, and the shape is consistent: the visitor-to-lead step is brutal, everything after it converts at roughly a third to a half.
| Funnel stage | Mid-sized targets ($10M to $100M revenue) | Enterprise targets ($1B+ revenue) |
|---|---|---|
| Visitor to lead | 1.4 percent | 0.7 percent |
| Lead to MQL | 41 percent | 34 percent |
| MQL to SQL | 39 percent | 40 percent |
| SQL to opportunity | 42 percent | 36 percent |
| Opportunity to close | 39 percent | 31 percent |
Source: First Page Sage, B2B SaaS Funnel Conversion Benchmarks (Evan Bailyn, last updated June 11, 2025). Columns are the annual revenue of the companies being sold to.
Read down the first column and multiply: 1.4 percent of visitors become leads, and about 2.6 percent of those leads become closed business (0.41 × 0.39 × 0.42 × 0.39). A team obsessing over the landing page is working on the first row; a team fixing lead-to-MQL is working on the row where 59 percent of what it already paid for disappears. The second is usually cheaper, and it is almost always a qualification problem rather than a persuasion one, which is where the five levers in the rest of this guide apply. The conversion rates by industry above tell you where your site should land; this table tells you which step to fix.
Lead conversion rate: definition and benchmark
The lead conversion rate is the share of leads that reach the next stage you care about, most often a qualified lead or a customer. Formula: leads converted ÷ total leads over the same period × 100. Always say which version you mean, because the two differ by a factor of ten or more.
A good lead conversion rate, in First Page Sage's data, is around 34 to 41 percent from lead to MQL. From lead all the way to a signed deal, multiplying the stages of the table gives about 2.6 percent for mid-sized targets and 1.5 percent for enterprise targets. If your lead-to-customer rate sits well under that, check who is in the lead list before you rework the pitch. Our page on lead qualification covers the criteria.
Calculate your own stage-by-stage conversion rates
Enter the number of leads or accounts at each stage of your funnel over the same period. The free calculator gives the conversion rate of every step, the end-to-end rate and the stage that loses the most. It runs in your browser: nothing is sent or stored.
B2B conversion rate by channel: search and paid do not convert alike
The same funnel behaves differently depending on where the visitor came from, and the gap is largest exactly where teams spend most. From the same First Page Sage funnel benchmarks for B2B SaaS, organic search (SEO) against paid search (PPC):
| Funnel stage | Organic search | Paid search |
|---|---|---|
| Visitor to lead | 2.1 percent | 0.7 percent |
| Lead to MQL | 41 percent | 36 percent |
| MQL to SQL | 51 percent | 26 percent |
| SQL to opportunity | 49 percent | 38 percent |
| Opportunity to close | 36 percent | 35 percent |
The MQL-to-SQL row is the one that pays for a strategy review: 51 percent from organic against 26 percent from paid, on the same product, at the same stage. Paid traffic converts into leads that look identical in the CRM and turn out to be twice as likely to fail qualification. That is not an argument against paid, it is an argument for qualifying earlier, before a rep spends an hour on a record. Enriching a lead the moment it lands, with headcount, sector and role, moves that decision from week two to minute one. Connect your LinkedIn account through the Derrick Chrome extension once, then: Enrich Leads returns the profile at 1 credit, and the free plan gives you 100 credits a month to test it on last month's inbound.
For the cost side of the same equation, our guide to cost per lead benchmarks by industry and channel puts a price on each of these visitors.
And outbound? Neither table measures cold outreach, where the realistic rate depends far more on the list than on the channel. Track reply rate and reply-to-meeting rate per list for a month before you compare yourself with anyone: a list full of outdated contacts drags both down before a single message is read.
In the web app or Google Sheets
Run the enriched half yourself
Case studies are someone else's split test. Enrich half of your next list with title, seniority and company, leave the other half as it is, and compare the reply rates on two batches that are otherwise identical.
- Feature
- LinkedIn Leads Profile Enrichment
- Credit cost
- 1 credit per lead enriched
The first button opens the web app (nothing to install): 1 credit per lead enriched, 100 free credits every month. The second details the feature and its cost per plan.
Lever #1: Data quality, and what an outdated list hides
This is the most underestimated lever, and yet the most documented. The quality of your prospect data has a direct, outsized impact on your conversion rate.
Test it on your own numbers
Take one campaign and split the contacts by the age of their data: enriched in the last 30 days against untouched for more than a year. Compare reply and meeting rates. Same script, same reps, same product. The only difference is how fresh the record is.
Why an outdated file kills your conversion rate
B2B contact data goes stale every month. A sales manager changes companies, a professional email goes inactive, a company reorganizes. Take an illustration: Mike, an SDR, makes 80 calls a day on a list nobody has refreshed in 18 months. Assume that on that list:
- 30 to 35 numbers are wrong or unreachable
- 15 contacts have changed roles
- 10 companies have restructured
Out of 80 attempts, barely 35 have a real chance of leading somewhere. His apparent conversion rate is 3%. On the contacts he could actually reach, it's closer to 7%. Bad data hides real commercial performance.
Regular data enrichment isn't optional. It's a structural condition for your conversion rates to reflect your actual effort. You'll find a complete breakdown of enrichment methods in our guide on database enrichment.
In Derrick, this refresh runs in the web app: import the list, run Enrich Leads to update roles and companies, then Email Finder for verified work emails (5 credits per email found, on paid plans), and export. The same features work in Google Sheets, in Claude through MCP and through the REST API.
Lever #2: Personalization and ICP Targeting
MarketingSherpa's often-quoted figure is that 79% of marketing leads never convert into sales, with weak lead nurturing named as the usual cause. Much of that loss starts upstream, with leads that never matched the target. That is the second major lever: targeting relevance.
Case study: ICP segmentation doubles meeting rate
A B2B SaaS startup selling scheduling software for the restaurant industry was prospecting indiscriminately across all verticals. Its lead-to-meeting conversion rate stagnated at 4%. After redefining its ICP - restaurant groups with 5 to 50 locations, centralized management, already using a POS system - and enriching its lists with the corresponding firmographic attributes, the rate climbed to 11% within two months.
The key variable: the message finally resonated with a specific pain point and a situation prospects recognized as their own.
What firmographic enrichment changes
Having a name and email is no longer enough. To personalize effectively, you need to know:
- Company size (employee count, estimated revenue)
- Industry and sub-industry
- Current tech stack
- Recent growth signals or hiring activity
These attributes allow you to craft messages that speak to a specific situation rather than a generic profile. Derrick's lead enrichment feature pulls these attributes from LinkedIn in the web app, in Google Sheets or through the API, with no manual lookups.
For a deeper dive into qualified lead generation, our B2B lead generation guide covers advanced targeting methods in detail, and our guide to improving lead quality shows how to filter a list before it reaches a rep.
The app works through your list row by row: 1 credit per lead enriched.
Lever #3: Speed-to-lead and what the research measured
This lever is counterintuitive, and one of the strongest. Leads360 (now Velocify) analysed close to 3.5 million leads from more than 400 companies in its 2012 study The Ultimate Contact Strategy: calling a new lead within one minute lifted conversion by 391%, against 36% when the call came within the first hour.
In other words, the one-minute call earned roughly ten times the lift of the one-hour call. Harvard Business Review reached the same conclusion from another angle in The Short Life of Online Sales Leads (Oldroyd, McElheran and Elkington, 2011): firms that tried to contact a lead within an hour were nearly seven times as likely to qualify it as firms that waited longer.
Case study: an HR software company cuts response time from 4 hours to 12 minutes
A mid-sized HR software publisher was receiving around 40 demo requests per week. Average first-contact delay was 4 hours (manual processing, lead assignment, rep pickup). Its demo request-to-meeting conversion rate was 22%.
After automating lead distribution through a workflow connected to HubSpot and setting a 15-minute response SLA, the average delay dropped to 12 minutes. The request-to-meeting conversion rate reached 38% within six weeks.
The lesson: speed is a form of personalization. A prospect who gets a fast response perceives an attentive, organized team - before you've even talked about your product.
Lever #4: Lead Scoring to Prioritize Effort
Reps lose a large part of their week to research, scheduling and admin rather than selling. Lead scoring sends that time toward the prospects most likely to convert.
How lead scoring works in practice
Scoring assigns a point value to each lead based on behavioral signals (pages visited, emails opened, content downloaded) and firmographic criteria (company size, industry, contact seniority). Leads that cross a defined threshold are routed as a priority to senior reps.
Case study: a consulting firm cuts sales cycles by 40%
Emma, Head of Sales at a digital transformation consultancy, was managing a pipeline of 200 active leads. Without scoring, reps worked leads in order of arrival. Sales cycles averaged 4 months and the lead-to-opportunity conversion rate sat at 18%.
After implementing a simple scoring model - based on company size, contact seniority, and website engagement - reps focused their energy on the top 30% of leads. Result: lead-to-opportunity conversion rate at 29%, average sales cycle reduced to 2.4 months.
Lead scoring is now accessible without technical skills thanks to AI-powered tools. With Derrick's Ask AI (Claude or GPT), you score a contact list against your own criteria, in the web app or in Google Sheets.
Lever #5: Email deliverability, the invisible conversion rate
A cold email campaign's conversion rate depends on one overlooked prerequisite: your emails need to land in the inbox. A rising hard bounce rate damages your domain reputation, and mailbox providers start filtering what you send. Recovering can take weeks.
Case study: an SDR team recovers 12 points of open rate
The SDR team at a fintech scale-up was sending 2,000 emails per week. Open rates plateaued at 18% despite carefully crafted subject lines. A deliverability audit revealed that 22% of contacts had invalid email addresses or unverified catch-all domains.
After running an email verification pass on the entire database - removing invalid addresses and flagging catch-alls - the hard bounce rate dropped from 4.8% to 0.9%. Open rates climbed to 30% in the very next campaign, without changing a single word in the emails themselves.
Every undelivered email is a conversion opportunity that's zero by definition. Email verification before sending isn't optional. It's the baseline condition for your whole sequence to perform. Our comparison of the best professional email enrichment tools covers how to automate this step.
How to Improve Your B2B Conversion Rate: A Step-by-Step Workflow
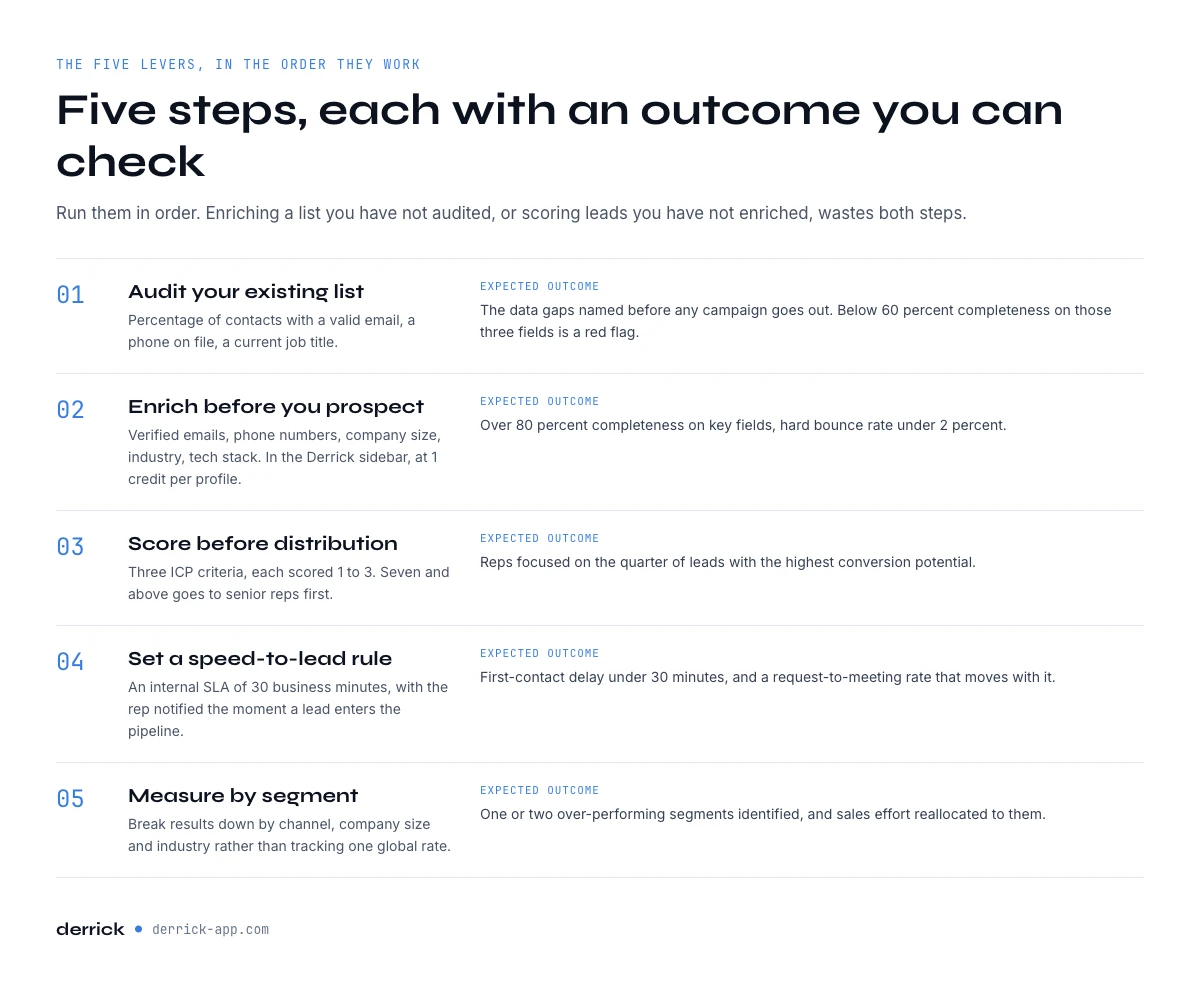
These five levers apply in a logical order. Here's the recommended workflow for any B2B sales team looking to improve its conversion rate durably.
Metrics to track alongside your conversion rate
A conversion rate on its own can rise while the business gets worse, for instance when you cut lead volume. Track it with four numbers:
- Cost per lead, by channel: a channel that converts well but costs four times more can still lose (see what each lead really costs you).
- Speed to lead: median minutes between a form fill and the first contact.
- Conversion rate by stage: each transition on its own, never only the end-to-end figure.
- Sales cycle length: days from first contact to signature. A higher rate with a cycle twice as long is not a win (see how to shorten the B2B sales cycle).
Step 1: Audit your existing list
Before sending a single email or making a single call, assess the state of your database. Calculate the percentage of contacts with a valid email, a phone number on file, and a current job title. A completeness rate below 60% on these three fields is a red flag.
Expected outcome: Clear identification of the data gaps to fill before any campaign goes out.
Step 2: Enrich your data before you prospect
Fill in the missing fields: verified professional emails, phone numbers, company information (size, industry, tech stack). In the web app or in Google Sheets, Derrick handles bulk enrichment from a LinkedIn URL or company name - no manual lookups required.
Expected outcome: List with 80%+ completeness on key fields, hard bounce rate under 2%.
Step 3: Score your leads before distribution
Define three primary ICP criteria (e.g., industry, company size, contact seniority). Score each lead 1 to 3 on each criterion. Leads scoring 7 or above go to senior reps first.
Expected outcome: Reps focused on the 25-30% of leads with the highest conversion potential.
Step 4: Set a speed-to-lead rule
Establish an internal SLA: every inbound lead must be contacted within 30 business minutes. Automate rep notifications the moment a lead enters the pipeline (via Slack, email, or your CRM).
Expected outcome: First-contact delay under 30 minutes, request-to-meeting conversion rate improved by 30 to 50%.
Step 5: Measure and iterate by segment
Don't track a single global conversion rate. It hides too much. Break down results by channel (email, call, LinkedIn), company size, and industry. The segment converting best should receive 70% of your effort over the next six weeks.
Expected outcome: One or two over-performing segments identified, sales resources reallocated accordingly. The full set of indicators to follow is in our list of data enrichment KPIs.
Mistakes That Kill a B2B Conversion Rate (and How to Fix Them)
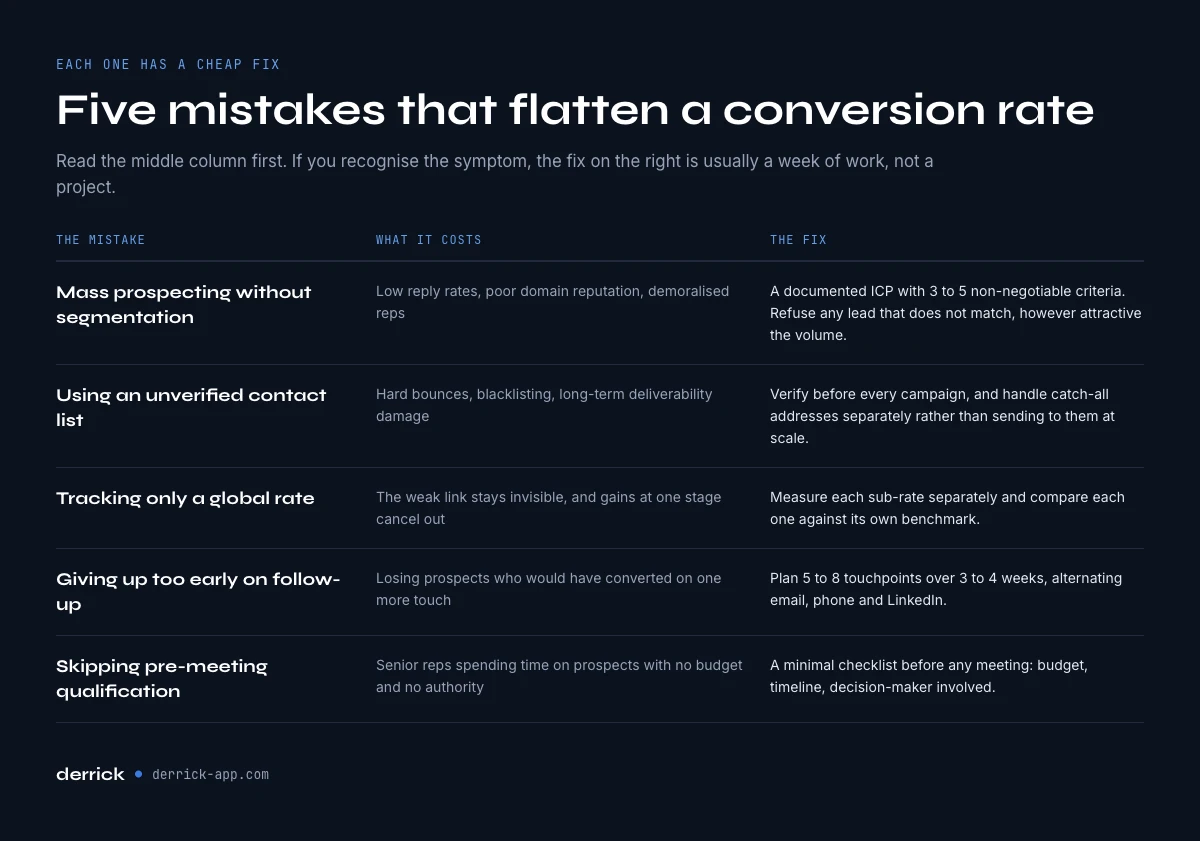
Problem 1: Mass prospecting without segmentation
Impact: Low reply rates, poor domain reputation, demoralized reps. Solution: Define a documented ICP with 3 to 5 non-negotiable firmographic criteria. Refuse any lead that doesn't match, however attractive the volume looks.
Problem 2: Using an unverified contact list
Impact: High hard bounces, domain blacklisting, long-term deliverability damage. Solution: Verify emails systematically before every campaign. Handle catch-all addresses separately, and never send to them at scale without extra validation.
Problem 3: Tracking only a single global conversion rate
Impact: Impossible to identify the weak link in the funnel. Improvements at one stage become invisible. Solution: Measure each sub-rate separately (visitor → lead, lead → meeting, meeting → opportunity, opportunity → customer). Compare each sub-rate against sector benchmarks.
Problem 4: Giving up too early on follow-up sequences
Impact: Losing prospects who would have converted with one more touchpoint. Many sequences stop after one or two follow-ups. Solution: Plan 5 to 8 touchpoints over 3 to 4 weeks. Alternate email, phone, and LinkedIn messages to maximize response chances.
Problem 5: Skipping pre-meeting qualification
Impact: Senior reps spending time on prospects with no budget or no decision-making authority. Solution: Use a minimal qualification checklist (budget, timeline, decision-maker involved) before any meeting. Delegate initial qualification to an SDR or automate it with an enriched intake form.
Key Takeaways
- Websites convert 1.1 to 3.1 percent of visitors in 23 of 24 B2B industries (First Page Sage, 2026); legal services is the outlier at 7.4 percent.
- From lead to signed deal, B2B SaaS funnels convert about 1.5 to 2.6 percent of leads, depending on who you sell to.
- In Leads360's study of 3.5 million leads, a call within one minute lifted conversion by 391%, against 36% within the hour.
- Most lost conversions are a qualification problem: fix who is in the list before you change the message.
- Deliverability conditions every rate after it: a high hard bounce rate hurts sender reputation and open rates.
- Tracking only a global conversion rate hides real bottlenecks - always segment by funnel stage, channel, and ICP segment.
Conclusion: Where to Start This Week
Getting a better rate isn't about raw talent. It's about method and execution at every funnel stage. The examples in this guide all point to data quality as the fastest gain: an enriched, verified list changes results before you've altered a single word in your emails or call scripts.
If you could only take one action this week: audit the quality of your contact data. Calculate the percentage of records with a valid email and an up-to-date phone number. If that rate is below 70%, you've found your first conversion lever.
Frequently asked questions
What is the typical conversion rate for B2B leads?
How do you calculate your conversion rate in B2B prospecting?
What impact does data quality have on conversion rates?
How many touchpoints does it take to close a B2B deal?
How can you improve conversion rates quickly without changing your product?
Is 2.5% a good B2B conversion rate?
What is a good lead conversion rate?
Keep reading
Continue exploring this cluster


The 10 Essential KPIs to Measure Your B2B Data Enrichment
Read →

Cost per Qualified Lead: How Data Enrichment Cuts Your CPQL in Half
Read →

How Data Enrichment Shortens Your B2B Sales Cycle
Read →

SDR Productivity: The Measurable Gains You Can Actually Hit
Read →