
Firmographic Data: The 30 Attributes That Matter for B2B Targeting
Firmographic data describes a company: size, industry, revenue, location. See 30 attributes, where to get each one and when to refresh it.


Firmographic data is the set of facts that describe a company rather than a person: its size, industry, revenue, location, legal structure, funding and growth. It does for B2B targeting what demographics do for consumer marketing. You use it to decide which accounts fit your offer before anyone writes a single email.
This guide lists the 30 firmographic attributes that matter most for B2B targeting, grouped in 8 categories. For each one you get what it tells you, where it usually comes from and how often it goes stale. That last part is the one most lists skip, and it's the one that decides whether your CRM fields are still true six months from now.
What is firmographic data?
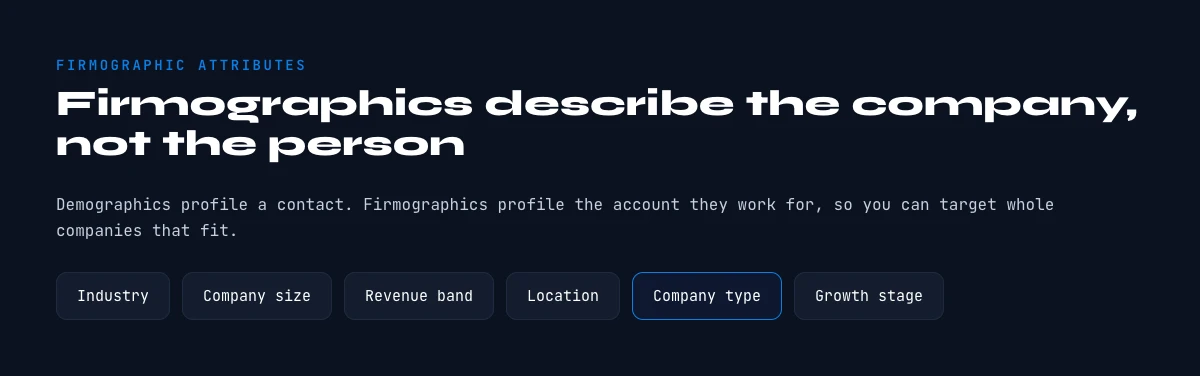
Firmographic data is information that describes an organization: how many people it employs, what it sells, where it operates, how much it earns, who owns it and how fast it grows. It lets you sort companies into segments on facts you can check, instead of on a hunch.
Each single field is a firmographic attribute. A firmographic attribute is a measurable, objective characteristic of a company. Just as demographic data (age, job title, income) describes individuals, firmographic attributes let you categorize and segment companies on specific criteria.
Together they answer the questions any B2B team asks before prospecting an account. How big is the company? Which industry is it in? How much revenue does it make? Where are its offices? What's its legal structure? Is it growing, flat or shrinking?
Firmographic attributes fall into two families:
- Descriptive attributes: what the company IS (size, industry, location, legal form)
- Behavioral attributes: what the company DOES (growth, hiring, funding rounds, new offices)
The descriptive ones tell you whether an account fits. The behavioral ones tell you whether now is a good moment to reach out.
Firmographic vs demographic vs technographic data
Three kinds of data get mixed up in B2B targeting. They describe three different layers of the same account. Firmographic data describes the organization. Demographic data describes the person you'll talk to inside it. Technographic data describes the tools the company runs. You usually need all three, in that order: first the company has to fit, then you find the right person, then you tune the pitch to their stack.
| Layer | What it describes | Example fields | What you use it for |
|---|---|---|---|
| Firmographic data | The company | Headcount, industry, revenue, country, founding year, ownership, funding | Deciding if the account fits your ICP, sizing the deal, building segments |
| Demographic data | The contact | Job title, seniority, department, location, years in role | Finding the decision-maker and personalizing the message |
| Technographic data | The company's tools | CRM, CMS, analytics, cloud provider, support tool | Spotting integration angles, displacement deals and digital maturity |
Example: a team selling HR software that only filters on the "HR director" title gets plenty of contacts, many at companies far too small or too large to buy. Add two firmographic filters first (say 50 to 200 employees, growing headcount) and the same title search returns a list that actually fits the product.
Why firmographic attributes are essential for your B2B strategy
The real cost of poor targeting
Bad targeting rarely shows up as one big loss. It leaks out in small ways that add up every quarter:
- Marketing campaigns that reach the wrong accounts (wasted budget)
- Sales reps prospecting companies that are too small or too large (wasted time)
- Longer sales cycles because the fit isn't there
- Early churn from customers who were poorly qualified from day one
Concrete benefits of precise firmographic targeting
Example: an SDR at an HR software company prospects 200 companies a week from a broad list. After segmenting the base on 8 attributes (headcount, growth, industry, location, funding, current HR stack, IT budget, digital maturity), the weekly list shrinks to a quarter of that. Fewer accounts, each one a real fit, and far more time per account to write something specific.
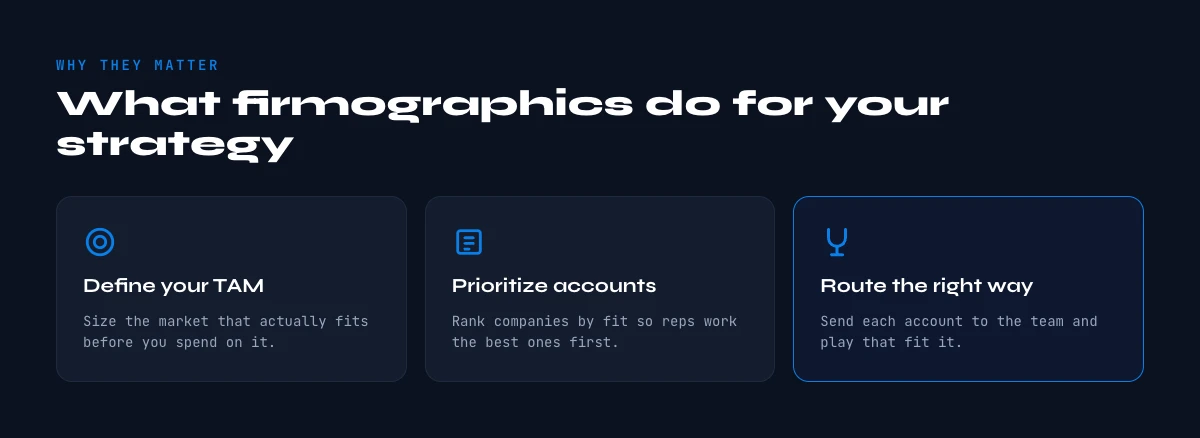
Firmographic data lets you:
- Build a precise ICP (Ideal Customer Profile): find what your best customers have in common
- Segment intelligently: create homogeneous segments so each one gets its own approach
- Prioritize your efforts: focus on the accounts with the highest potential
- Personalize at scale: adapt your messaging to each firmographic profile
- Align Sales and Marketing: share one definition of the "right prospect"
- Measure performance: see which attributes correlate with won deals
None of this works if the fields are empty or wrong. Which is why the rest of this guide spends as much time on where firmographic data comes from as on what it means.
In the web app or Google Sheets
The firmographic block, filled per account
Thirty attributes are only usable if they arrive together. Derrick enriches the account row from a LinkedIn page or a domain and returns the firmographic block in one call: name, industry, headcount band, location, description.
- Feature
- LinkedIn Companies Profile Enrichment
- Credit cost
- 1 credit per company enriched
The first button opens the web app (nothing to install): 1 credit per company enriched, 100 free credits every month. The second details the feature and its cost per plan.
Firmographic data examples: the 30 attributes by category
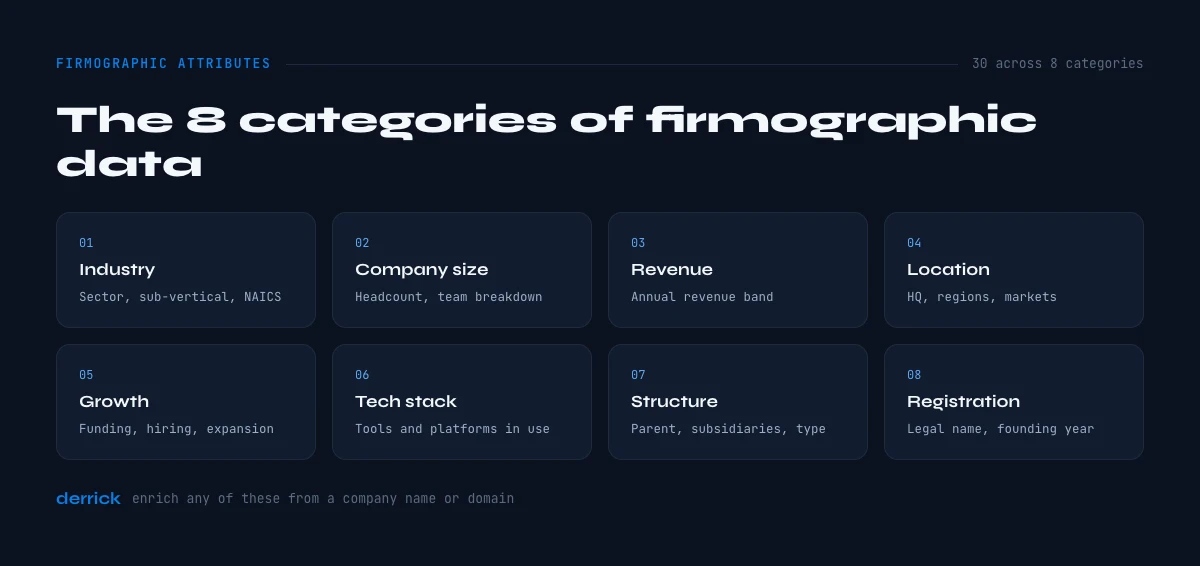
Every attribute below is a firmographic data example you'll find in a well-kept CRM. They're grouped in 8 categories, from identity to commercial model.
Category 1: Company Identity & Structure (7 attributes)
These fundamental attributes define the legal and organizational identity of the company.
1. Company name (legal name) The official legal name of the organization. Essential for searches in official registries and for confirming the company exists.
Usage example: a tech recruiter checks the legal name every time to avoid homonyms and reach the right legal entity.
2. Trade name (DBA, Doing Business As) The name under which the company operates commercially, often different from the legal name.
Usage example: a company can be registered as "Northwind Holdings LLC" and be known in its market simply as "Northwind".
3. Unique identification number (EIN, VAT, Company Number) The company's tax and legal identifier, depending on the country (EIN in the USA, VAT number in Europe, Company Number in the UK).
Usage example: a Sales Ops lead at a fintech uses the identifier as the matching key to enrich CRM records and catch duplicates.
4. Legal structure The company's legal form: Inc., LLC, Corp., LLP, non-profit, association, cooperative, etc.
Why it matters: legal structure hints at how formal the company is and often at its size. A 5-person LLC doesn't buy the way a publicly traded corporation does.
5. Ownership status Classification by ownership type: public company (listed), private, PE-backed, subsidiary of a group, government-owned, or non-profit.
Usage example: a cybersecurity rep adapts the pitch to ownership. For listed companies, regulatory compliance comes first. For VC-backed scale-ups, it's about scaling without breaking.
6. Parent company and subsidiaries The parent company and its subsidiaries, when the account belongs to a group.
Why it's critical: group structure tells you who holds the budget. A subsidiary director may love your product, but if the budget sits at headquarters, you need to go up the chain.
7. Founding date and company age How long the company has existed since its official creation.
Usage example: a marketing manager at an IT services provider runs two segments: startups under 2 years old (need to scale fast, tight budget) and established companies over 10 years old (need modernization, more room in the budget).
Category 2: Size & Headcount (3 attributes)
Company size is one of the most decisive firmographic criteria.
8. Number of employees Total headcount, usually grouped in ranges: 1-10 (micro), 11-50 (small), 51-200 (medium), 201-1000 (large), 1000+ (enterprise). The lower bands are where most SMB definitions sit.
Why it's the king of attributes: headcount moves with available budget, organizational complexity and the buying process. A 500-person company has more people to equip, more processes to tool and more sign-offs than a 50-person one.
Usage example: a software rep keeps three pitches by size. For 10-50 employees: quick payback and simplicity. For 200-500: integration with the existing stack. For 1000+: proof of scale and enterprise support.
9. Headcount growth rate The change in employee count over a period (usually 6 or 12 months), as a percentage.
A strong buying signal: a company that grows its workforce by a fifth in six months is in hyper-growth. It needs tools that scale, processes that hold and help absorbing new hires.
Usage example: a BDR at an HR platform only targets companies with double-digit headcount growth over the last 12 months, because that's when onboarding and payroll start hurting.
10. Turnover and retention Employee churn rate, an indicator of organizational health.
What this attribute reveals: high turnover (say, above 20% a year) can signal HR problems, and also an opening for recruiting, onboarding or culture tools.
Category 3: Financial Performance (5 attributes)
Financial firmographic data tells you how much the company can spend and invest.
11. Annual revenue Total revenue over one year, usually grouped in ranges: <$1M, $1-10M, $10-50M, $50-100M, $100M+.
Direct link with budget: technology spend grows with revenue. A company making a few million a year can afford a B2B SaaS subscription; a company making a few hundred thousand will think twice about every line.
Usage example: an account executive selling a product priced around $50K a year sets a minimum revenue threshold, so the deal stays a small share of what the buyer already spends on software.
12. Revenue growth rate How revenue evolves over a period, in percentage or absolute value.
Momentum indicator: a company growing 50% year over year is investing. It's hiring, opening new markets, rebuilding its stack. A good time to sell.
13. Profitability and margins Net income, EBITDA or operating margins.
Important nuance: a hyper-growth startup can run negative margins on purpose (investment phase). A profitable 20-year-old family business, on the other hand, watches every expense.
14. Credit rating (credit score) An assessment of the company's financial health and solvency, issued by credit bureaus.
Risk protection: before signing a large contract or granting payment terms, checking the credit score avoids bad surprises.
15. Funding rounds and financing Amount and date of the latest funding rounds (for startups), or debt information (for established companies).
Golden signal for tech prospecting: a startup that just raised a Series A usually plans to spend it over the next year or two. It will hire, buy tools and structure its operations.
Usage example: a partnerships lead at a payment provider watches funding announcements and press releases. When a fintech raises, the team reaches out within 30 days with a partnership offer.
Category 4: Geographic Location (4 attributes)
Geography shapes needs, budgets and regulatory constraints.
16. Headquarters (HQ) The company's main address, including city, region and country.
Beyond the address: HQ says something about culture. A San Francisco startup doesn't work like an industrial manufacturer in Detroit. An HQ in London often comes with an international mindset.
Usage example: an office furniture seller segments by city. NYC: bigger budgets, design first. Austin: tech-forward, flexible spaces. Chicago: more conservative, durability first.
17. Secondary offices and locations The company's other sites (branches, agencies, factories, warehouses).
Maturity indicator: a company with 5+ locations is past the startup stage. It has cross-site communication problems, process standardization needs and distributed IT.
18. Geographic coverage zone The markets where the company operates: local, regional, national, European, international, global.
Usage example: a marketer at an e-commerce platform targets brands that sell locally or regionally with national ambitions. That's the moment they need to scale.
19. Primary market (domestic vs international) Share of revenue from the domestic market versus abroad.
Multiple implications: a company that exports most of what it sells needs multi-currency, multi-language, international compliance and timezone handling.
Category 5: Industry & Vertical (3 attributes)
Industry determines business needs, sales cycles and regulatory constraints.
20. Industry vertical Primary activity: SaaS, e-commerce, healthcare, finance, manufacturing, real estate, education, professional services, etc.
The most personalizable attribute: each industry has its own words, pain points and KPIs. A rep who speaks the buyer's language gets more replies than one reading a generic script.
Usage example: a CRM vendor builds one landing page per industry. The "CRM for real estate agencies" page talks about listings, showings and closings, the words agents actually use, instead of generic pipeline vocabulary.
21. SIC / NAICS / NACE code Official activity classification under standard nomenclatures (SIC in the USA, NAICS in North America, NACE in Europe).
Technical usage: these codes give you a precise industry cut and exports that match national statistical standards.
22. Sub-sector and niche Specialization inside a broader industry.
The level of detail that makes the difference: don't sell to "a tech company". Sell to "a 50-200 person B2B SaaS company specialized in HR tech". The more precise you are, the more your message lands.
Category 6: Organization & Structure (4 attributes)
How a company is organized changes the sales cycle and who decides.
23. Number of departments and divisions The company's organizational complexity.
Maturity indicator: a 30-person startup is usually flat. A 200-person scale-up has proper departments. A 1000+ company has divisions, business units and layers of hierarchy.
24. Purchase process (centralized vs decentralized) Where budget decisions are made: at HQ, in each subsidiary or in each department.
Changes everything: if it's centralized, a deal in a subsidiary has to be approved at HQ, so you need internal champions who escalate. If it's decentralized, each subsidiary director owns a budget and can sign alone.
25. Average sales cycle length Average time between first contact and signature, a proxy for decision complexity.
Usage example: a sales director knows that large banks take close to a year to sign. The forecast reflects it, and nobody chases those reps for a close in month two.
26. Number of decision-makers in the buying process Size of the buying committee, which usually grows with company size.
Why it counts: in large companies, a B2B purchase involves several people across departments, each with a veto. The larger the company, the more complex the sale you have to orchestrate.
Category 7: Technologies Used (2 attributes)
Technographic data is a neighboring layer: it describes the company's tools rather than the company itself, and it's often collected together with firmographic data. The full topic has its own guide on tech stack data. Two attributes sit right at the border.
27. Current tech stack Tools and technologies the company uses: CRM, ERP, marketing tools, cloud infrastructure, etc.
SaaS sellers' favorite attribute: knowing a company runs HubSpot lets you adapt your integration pitch. Knowing it runs Salesforce usually points to a more mature sales organization.
Usage example: a ticketing vendor filters companies that already use Intercom or Zendesk. They have a support culture and get the value of a complementary tool fast.
28. Annual IT budget Amount spent on technology per year, often estimated as a share of revenue.
How to use it: you'll rarely get the real figure. Treat it as an estimate derived from revenue and headcount, and use it to rank accounts rather than to quote numbers back to the prospect.
Category 8: Commercial Data (2 attributes)
These attributes describe the business model and the target market.
29. Target market segment The company's typical customers: SMB, mid-market, enterprise, or a mix.
Why it's revealing: a company selling to enterprise accounts knows long cycles and structured processes. You can talk ABM, custom demos, pilots. A company selling to SMBs cares about volume, self-service and quick payback.
30. Customer type (B2B / B2C / B2G) The company's primary commercial orientation.
Cultural implications: a B2C company thinks user experience, virality, acquisition at scale. A B2B company thinks long-term relationships, lifetime value, NRR. A B2G company thinks compliance, procedures, public procurement.
Usage example: a marketing ops lead at an analytics tool rewrites the messaging by customer type. B2C: "Understand your users at scale." B2B: "Reduce churn and grow NRR." B2G: "WCAG compliant and FedRAMP authorized."
Firmographic data sources and refresh cadence, attribute by attribute
A list of attributes tells you what to collect. It doesn't tell you where to get each field or when it stops being true. The table below does both. The refresh cadence is our recommendation, based on how fast each attribute tends to move: a founding year never changes, a headcount moves every quarter, a hiring signal can flip in a month. Adjust it to your own sales cycle.
The last column says which fields Derrick fills automatically from a company list, and with which feature. "No" doesn't mean the field is useless, it means you'll get it from another source (a registry, a form, your own CRM).
| # | Attribute | Main source | Suggested refresh | Filled by Derrick? |
|---|---|---|---|---|
| 1 | Legal name | Official registry | Stable (check on M&A) | No |
| 2 | Trade name | Website, LinkedIn page | Yearly | Yes (Enrich Companies: company name) |
| 3 | Unique identifier | Official registry | Stable | No |
| 4 | Legal structure | Official registry | Yearly | No |
| 5 | Ownership status | Registry, filings, press | Yearly | No |
| 6 | Parent and subsidiaries | Registry, annual report | Yearly | No |
| 7 | Founding date | Registry, LinkedIn page | Stable | Yes (Enrich Companies: founding year) |
| 8 | Number of employees | LinkedIn page, registry, form | Quarterly | Yes (Enrich Companies: headcount and range) |
| 9 | Headcount growth | Two headcount snapshots, job posts | Monthly | Hiring status only (Company Hiring Signal) |
| 10 | Turnover | Survey, HR disclosures | Yearly | No |
| 11 | Annual revenue | Filings, registry, form | Quarterly | No |
| 12 | Revenue growth | Filings | Quarterly | No |
| 13 | Profitability | Filings | Yearly | No |
| 14 | Credit rating | Credit bureaus | Quarterly | No |
| 15 | Funding rounds | Press releases, funding announcements | Monthly | No |
| 16 | Headquarters | Registry, LinkedIn page | Yearly | Yes (Enrich Companies: country, city) |
| 17 | Secondary offices | Website, LinkedIn page | Quarterly | No |
| 18 | Geographic coverage | Website | Yearly | No |
| 19 | Primary market | Filings, survey | Yearly | No |
| 20 | Industry vertical | LinkedIn page, registry | Yearly | Yes (Enrich Companies: industry) |
| 21 | SIC / NAICS / NACE code | Official registry | Yearly | No |
| 22 | Sub-sector | Website, manual review | Yearly | No |
| 23 | Departments | LinkedIn employee distribution | Yearly | No |
| 24 | Purchase process | Sales discovery | Yearly | No |
| 25 | Sales cycle length | Your CRM | Quarterly | No |
| 26 | Decision-makers | Your CRM, discovery calls | Quarterly | No |
| 27 | Tech stack | Website scan | Monthly | Yes (Website Technologies, paid plans) |
| 28 | IT budget | Estimate from revenue, survey | Yearly | No |
| 29 | Target market segment | Website, case studies | Yearly | No |
| 30 | Customer type | Website | Yearly | No |
Read it as four speeds. Stable: legal name, identifier, founding date. Yearly: structure, ownership, industry, coverage. Quarterly: headcount, revenue, offices, credit rating. Monthly: growth, funding, hiring, tech stack. If you only have time to refresh one group, refresh the monthly one on your open pipeline: those are the fields that turn an account from "maybe later" into "call this week".
The app works through your list row by row: 1 credit per company enriched.
Firmographic segmentation: build your ICP in 4 steps
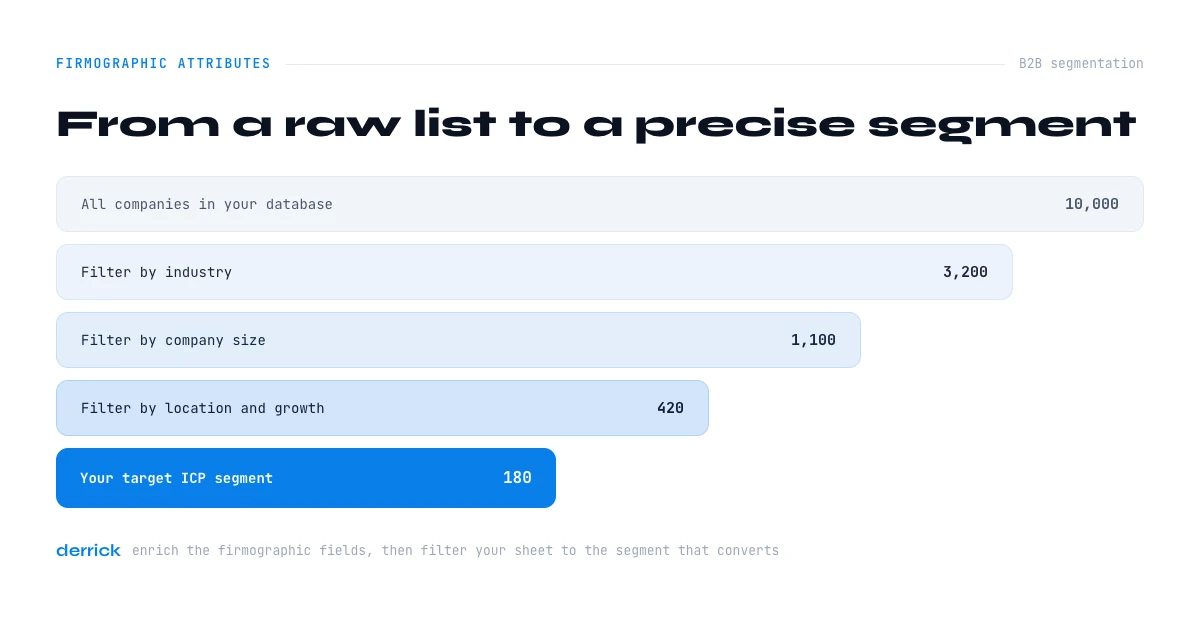
Firmographic segmentation means splitting your market into groups of companies that share the same profile, so each group gets its own message, offer and priority. It runs on firmographic data and starts with your ICP.
Build your ICP (Ideal Customer Profile) in 4 steps
A useful ICP combines 8 to 12 firmographic attributes that describe your best customers. Here's how:
Step 1: Analyze your current best customers
Export your customer base and rank it by performance: NRR, lifetime value, churn, ease of sale, time to close. Pick out the top fifth of customers, the ones who bring revenue AND are easy to work with.
Step 2: Identify firmographic patterns
For these top customers, note what they have in common:
- Size: is there a dominant employee range?
- Industry: are some verticals over-represented?
- Location: does one geography perform better?
- Growth: are your best customers in hyper-growth or stable?
- Tech stack: do they use the same tools?
Step 3: Define your primary ICP
Example: the CMO of a project management platform looks at the customers with the best NRR and finds a recurring profile:
- Headcount: 50-200 employees
- Industry: agencies (marketing, design, dev) and SaaS startups
- Growth: headcount up over the last 12 months
- Location: US + Canada
- Stack: already using Slack and a modern CRM
- Status: recent funding (<18 months) OR profitable for 2+ years
Written down and shared with Sales and Marketing, that profile becomes the filter everyone uses. That shared filter is the whole point: two teams targeting the same accounts instead of two different guesses.
Step 4: Create a scoring system
Give points for each match with the ICP. The full method, with weights and thresholds, is in our guide to building a lead scoring model.
| Attribute | Points if match |
|---|---|
| Headcount 50-200 | +20 points |
| Agency or SaaS industry | +15 points |
| Growth +20% | +15 points |
| US/Canada | +10 points |
| Uses Slack | +10 points |
| Recent funding | +10 points |
A lead scoring 60+ points goes straight to sales. Between 40 and 60, it goes to nurturing. Below 40, it's disqualified.
Firmographic segmentation examples: beyond the single ICP
Multi-segmentation by profile
Example: a VP Sales at an HR software company realizes there are really three ICPs in the customer base:
- Scale-up segment: 100-500 employees, Series A/B funding, needs to structure HR
- Mature SMB segment: 200-1000 employees, 10+ years old, needs modernization
- Mid-market segment: 1000-5000 employees, complex processes, needs integration
Each segment gets its own pitch, pricing and customer stories, and reps specialize by segment. Same product, three conversations.
Behavioral segmentation
On top of static firmographic data, watch for signals that something just changed:
- Hiring signal: 5+ job openings in 30 days means the company is scaling and needs tools. Company Hiring Signal tells you whether an account is hiring, for 1 credit per company.
- Funding signal: a recent funding announcement means cash to invest
- Expansion signal: a new office means new processes to set up
- Tech signal: a new tool in the stack means the company is digitizing and open to change
On paid plans (from STANDARD, €20/month), Signal sends alerts when tracked accounts raise funds, hire or change their stack, so you don't have to check by hand.
How to collect and enrich your firmographic data
To see the 30 attributes side by side on a real organization rather than in the abstract, open a filled profile such as Oracle, or browse the full set of company profiles. For an entity where the org chart carries as much signal as the firmographics, The Walt Disney Company's leadership shows how the two layers read together.
The 4 sources of firmographic data
1. First-party data (your own sources)
Information you collect directly:
- Web forms (signup, demo request)
- Qualification surveys
- CRM data entered by your sales team
- Analytics and behavioral tracking
Advantages: reliable because it's self-declared, and you know exactly where it came from. Disadvantages: slow, incomplete (prospects skip fields), needs resources.
2. Public data
Sources you can access for free or close to it:
- Official registries (Companies House, SEC, etc.)
- Company websites ("About", "Team", "Careers" pages)
- LinkedIn (company pages, employee profiles)
- Professional social networks
- Press releases
Advantages: free, legal, verifiable. Disadvantages: very slow to collect by hand, often out of date, hard to keep consistent across thousands of rows.
3. Data enrichment platforms
Tools that collect firmographic data from public sources and return it in a structured format, row by row. That's the job Derrick does: you give it a company name, a domain or a LinkedIn page, it returns the firmographic block.
Advantages: automatic, consistent formats, refreshable on demand, API integration. Disadvantages: costs credits, and coverage varies by field (see the table above).
4. B2B database purchase
Buying segmented lists from brokers or specialized platforms.
Advantages: fast for volume. Disadvantages: quality varies a lot, records are often old by the time you load them, and there's a legal risk if the source isn't clear.
Firmographic questions to ask in a form or survey
First-party firmographic data is the most reliable you'll get, as long as you ask short questions with fixed answers. Six questions cover most needs:
- How many people work at your company? (1-10, 11-50, 51-200, 201-1000, 1000+)
- Which industry best describes your company? (fixed list, not free text)
- In which country is your company headquartered?
- What is your role in choosing a tool like ours? (decide, recommend, use, other)
- Which tools do you use today for this job? (CRM, spreadsheet, other)
- When do you plan to make a decision? (this month, this quarter, later)
Keep the form to three or four of them at signup, ask the rest during onboarding. Every field you add costs you some signups.
Fill firmographic data from a company list in Derrick
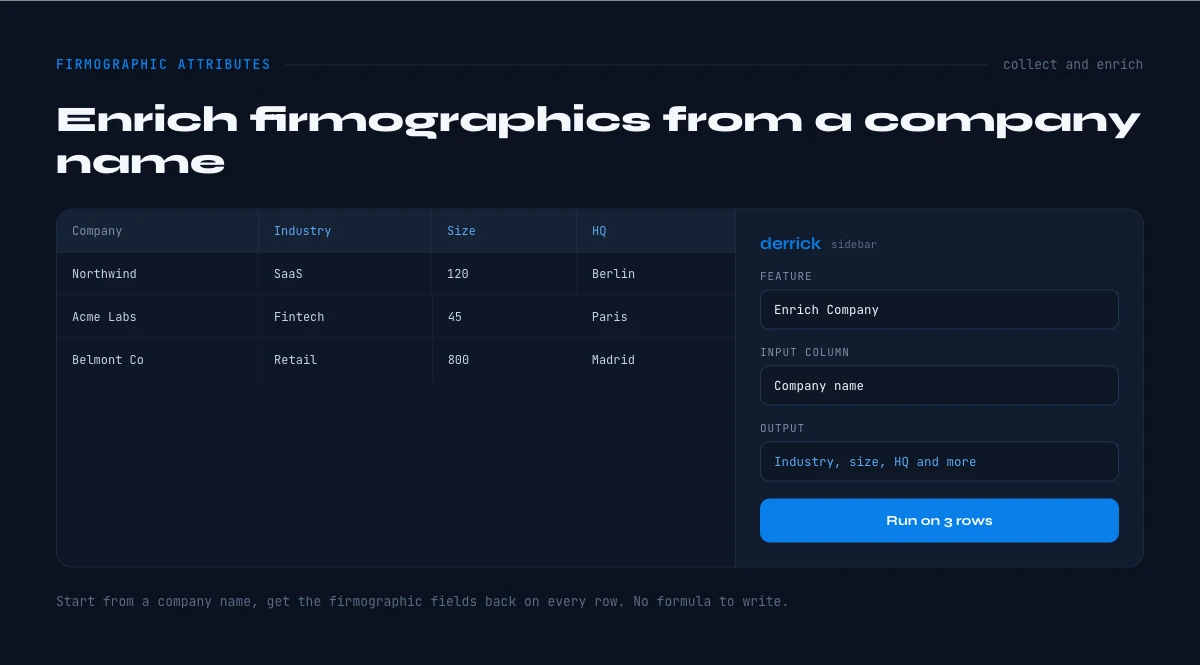
In the Derrick web app, you import or paste a list of companies (names, domains or LinkedIn pages) and run Enrich Companies. For 1 credit per company, each row gets the company name, website, LinkedIn URL, founding year, tagline, headcount and headcount range, phone, country, region, city and industry. Nothing to install.
From there, three features extend the list:
- Find Similar Companies (1 credit per company) builds a lookalike list from your best accounts, to widen the ICP
- Company Hiring Signal (1 credit per company) adds whether each account is hiring right now
- Website Technologies (2 credits per website, paid plans) adds the tech stack read from the company's site
Or use it in the surface that matches your workflow. Google Sheets, through the sidebar, if your list already lives in a spreadsheet. Claude, through MCP, for a one-off question like "what's the headcount of this company?". The REST API, from the PLUS plan, to enrich every new account the moment it's created in your CRM. The free plan gives you 100 credits a month, no card needed.
The optimal enrichment workflow
Step 1: Audit your current CRM
Measure the fill rate of each company field: what share of accounts have a headcount, an industry, a country, a revenue range. Most CRMs that nobody owns have large gaps on revenue and headcount, plus duplicates from misspelled company names. Write the numbers down, they're your baseline.
Step 2: Define priority attributes
Don't try to enrich all 30 attributes at once. Start with the 8-10 that weigh most on your targeting. For example:
- Headcount
- Industry
- Estimated revenue
- Location
- Growth
- Tech stack (if relevant to you)
Step 3: Implement automatic enrichment
Use an enrichment platform such as Derrick, with:
- Enrichment at account creation, via the REST API (PLUS plan and up)
- Monthly batch enrichment (to refresh the base)
- On-demand enrichment by sales reps, from the web app
Step 4: Normalization and deduplication
Once enriched, clean your base:
- Standardize formats (e.g., every headcount as "50-200", not "50 to 200 employees")
- Detect duplicates (same identifier, same web domain)
- Create calculated fields (e.g., "Size segment" based on headcount)
Step 5: Continuous maintenance
Firmographic data moves:
- A startup grows from 20 to 80 employees in 18 months
- A small company raises funds and changes segment
- A company opens an office abroad and changes geographic zone
Golden rule: re-enrich your active accounts (pipeline + customers) every 3 months at least, and the monthly fields more often.
Quality control: how to judge a source and keep records accurate
How to evaluate firmographic data providers
Every vendor says its firmographic data is accurate. Ask questions you can check instead. Five criteria separate firmographic data providers that hold up from the ones that look good in a demo:
- Coverage of your segments: test on a sample of your own target accounts, not on household names. A provider strong on US enterprise can be thin on 20-person companies in Europe.
- Verification method: ask where each field comes from (registry, website, LinkedIn page, model estimate) and how it's checked. An estimated revenue should be labeled as an estimate.
- Refresh frequency: ask when a record was last updated, field by field. A headcount from two years ago is a guess, not a data point.
- Fill rate per field: an overall "match rate" hides empty columns. Ask for the share of your sample that comes back with headcount, industry, country and revenue, separately.
- CRM and API integration: check you can enrich at the moment an account is created, and refresh in batches later, without exporting CSVs by hand.
Run the test on 100 of your accounts, compare two or three firmographic data providers on the same sample, and pick on the fill rate of the fields you actually use.
How to keep firmographic data accurate
- Track the fill rate per field every month. A drop means a new source is feeding empty rows into the CRM.
- Cross-check two sources on the fields that drive routing (headcount, country). When they disagree, flag the record instead of picking one at random.
- Refresh by field, not by record: follow the cadence of the table above, monthly fields first.
- Deduplicate before you enrich: you pay once per company, not once per duplicate. In Google Sheets, Find Duplicates is free and flags repeated domains or names in one pass.
Records go stale faster than most teams think. Our report on firmographic decay looks at what stale company data costs.
Fatal mistakes to avoid with firmographic attributes
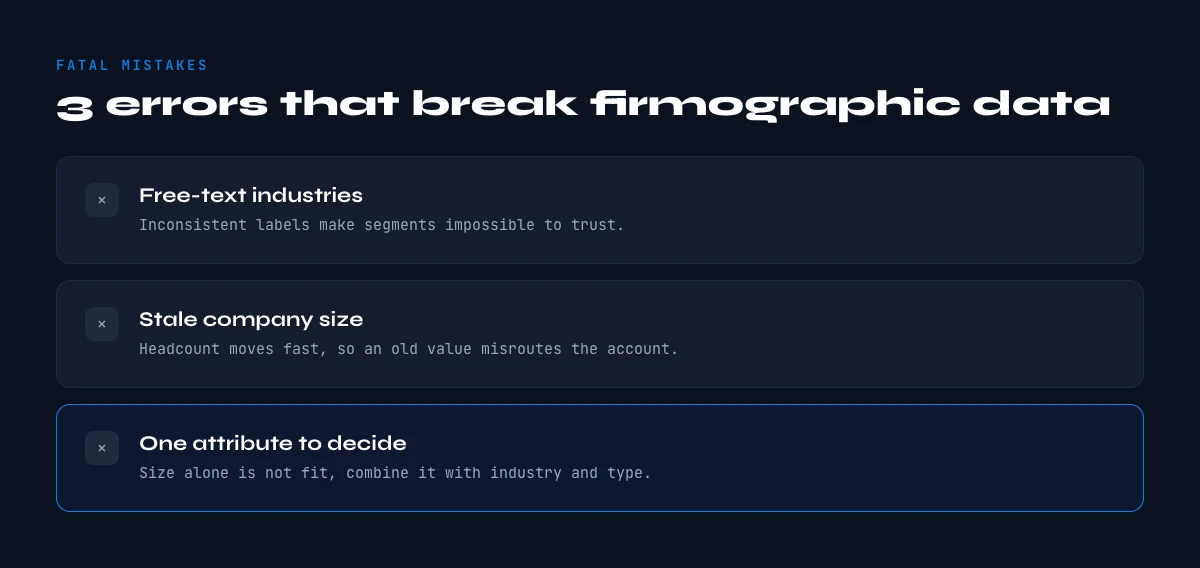
Mistake #1: Relying on outdated firmographic data
Impact: you're prospecting a "15-person startup" that has 120 people today. Your "solution for small teams" pitch misses their real needs. You lose the deal.
Solution: set up automatic refresh. Headcount, funding and hiring move within months, so a yearly enrichment isn't enough on active accounts. Go quarterly at least, monthly on the fast fields.
Mistake #2: Too many attributes kills the attribute
Symptom: you collected 40 attributes per company, and nobody uses them because it's too much.
Impact: your reps drown in firmographic data and go back to gut feeling to qualify. All the enrichment work goes to waste.
Solution: start with 8-10 attributes max. Once Sales uses them every day, add more, one at a time. Example: a Sales Ops lead starts with 6 attributes (headcount, industry, location, revenue, growth, tech stack) and only adds 4 more after three months, once the first six show up in every qualification call.
Mistake #3: Not aligning Sales and Marketing on definitions
Impact: Marketing qualifies a lead as "Mid-Market" (200-1000 employees) and hands it to Sales. Sales rejects it because for them "Mid-Market" means 500-2000 employees. The lead falls between two chairs.
Solution: write a shared reference document that defines each segment precisely. Example of a clear definition:
- SMB Segment: 10-200 employees, <$5M revenue, 1-2 decision-makers
- Mid-Market Segment: 200-1000 employees, $5-50M revenue, 3-5 decision-makers
- Enterprise Segment: 1000+ employees, $50M+ revenue, 6+ decision-makers
Mistake #4: Ignoring qualitative attributes
Trap: you filter only on numbers (headcount, revenue) and ignore qualitative signals (culture, digital maturity, openness to new tools).
Example: two 300-employee retail companies. One is a traditional family chain, the other an online pure player. Same size, same industry, completely different needs and buying processes.
Solution: add qualitative fields to your enrichment: digital maturity, management style (hierarchical vs flat), innovation culture, social media presence.
Mistake #5: Not measuring enrichment ROI
Symptom: you pay for enrichment but can't tell whether it improves results.
Solution: measure these KPIs before and after enrichment:
- Lead to opportunity conversion rate
- Average deal size
- Sales cycle length
- Win rate (opportunity to customer)
- Prospecting time per lead
Conclusion: turn firmographic data into a competitive advantage
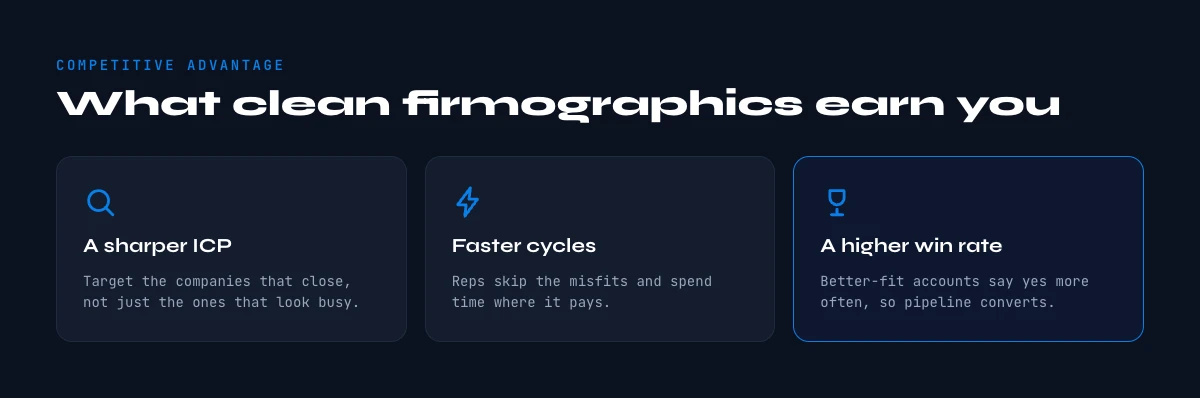
The 30 firmographic attributes in this guide aren't a checklist to tick off. They're the base of a go-to-market that knows who to target, when and how. Teams that keep these fields filled and fresh spend their time on accounts that can actually buy.
The timing is now. Lots of teams still prospect from old purchased lists. You can build your pipeline on fresh firmographic data instead.
Where to start today:
- Audit your CRM: pick the 8 attributes that matter most for your business and measure their fill rate
- Define your ICP: look at your top customers and write down what they share
- Set up automatic enrichment: use a platform like Derrick to keep the base filled, on the cadence of the table above
- Train your teams: make sure Sales and Marketing use these attributes to qualify and prioritize
Teams that do this well don't prospect more accounts. They prospect better ones, at the right moment, with a message that fits.
Frequently asked questions
What is firmographic data?
What is an example of firmographic data?
What's the difference between firmographic and demographic data?
Is technographic data part of firmographic data?
How many firmographic attributes should I use to qualify leads?
Which firmographic attributes matter most for building an ICP?
How often should firmographic data be refreshed?
Can you use firmographic data for account-based marketing (ABM)?
Keep reading
Continue exploring this cluster


The 20 Essential Contact Attributes to Nail Your B2B Prospecting
Read →

B2B Demographic Data: Definition, Types & Complete Usage Guide
Read →

Technographic Data: How to Identify Your B2B Prospects' Tech Stack
Read →

How to Find Company Financial Data: Revenue, Funding and Growth Signals
Read →