
Technographic Data: How to Identify Your B2B Prospects' Tech Stack
B2B technographic data explained: what it is, where it comes from, how to read a prospect's tech stack in 5 steps, and what it costs per site.


Technographic data (or technographics) is the set of facts about the technology a company actually runs: the CRM it logs deals in, the marketing software it sends from, the analytics and tag managers loaded on its website, the cloud and hosting behind its domain, and the tools it is publicly hiring for. Firmographics say what a company is; technographics say what it works with. In B2B sales, that difference is what turns a list of names into a list of accounts you can qualify.
What technographics are not. They are not demographics, which describe a person. They are not firmographics, which describe headcount, revenue, industry and location. And they are not intent data: a technology detected on a domain is an observed fact, not a sign that the company is shopping for something.
- Where the facts come from: page source and tag signatures on the public website, DNS and MX records, job postings that name a tool, and public review or marketplace listings.
- What one detection returns: the technology name, its category (CRM, analytics, CMS, hosting, payment, chat, marketing automation) and the domain it was observed on.
- What it costs with Derrick: Website Technologies is 2 credits per website, on a paid plan. On STANDARD (20 EUR for 10,000 credits) that is 0.004 EUR a site.
- How fast it goes stale: front-end tags change every time a site is redesigned or a contract is renewed, so a detection older than one quarter is worth re-running before you put it in a pitch.
- Related attributes in this series: firmographic attributes, timing attributes, behavioral attributes and how they feed a lead scoring model.
- Four ways to collect it: the web app, with nothing to install, the Google Sheets sidebar for a list of domains you already hold in a sheet, the REST API when detection belongs inside a workflow, and the MCP server when you would rather ask from Claude or another AI client.
Picture this: You've been prospecting a company for weeks, investing hours crafting the perfect pitch, only to discover during your first call that their technical infrastructure is completely incompatible with your solution. Sound familiar?
That is the problem B2B technographic data solves. If you know which tools a prospect runs before you reach out, you can drop the accounts that will never fit and write to the others about something they actually use.
What is technographic data?
Technographic data is the list of technologies a company uses, read from public signals: its website code, DNS records, job postings and what its team says in public. B2B technographic data turns that list into a field you can filter, score and write about.
In practice it covers the software, tools, frameworks, cloud infrastructure and applications that power a company's daily operations.
Specifically, this includes everything a company uses to function: their CRM (Salesforce, HubSpot, Pipedrive), marketing tools (Marketo, Pardot, Mailchimp), cloud infrastructure (AWS, Azure, Google Cloud), collaboration tools (Slack, Microsoft Teams), website (WordPress, React, Angular), and much more.
For an SDR prospecting 200 leads per day, this data is a complete game-changer. Instead of sending a generic cold email, they can personalize their approach: "I noticed you're using Salesforce. Our solution integrates natively with your CRM to automate X process that currently takes your team Y hours per week."
The difference between prospecting with and without technographic data is mostly about waste: fewer calls with accounts that can never use your product, and first messages that start from the prospect's own tools.
Technographic vs firmographic vs demographic vs intent vs behavioral data
Five kinds of data get mixed up in B2B targeting. Each one answers a different question, and technographic data is the only one that tells you whether your product can plug into the account's stack:
| Data type | What it reveals | Example | Question it answers |
|---|---|---|---|
| Firmographic | Size, industry, revenue, location | SaaS company, 50 employees, Austin TX | Is this the kind of company we sell to? |
| Demographic | Name, title, seniority, tenure | Head of Sales, 5 years in the role | Who inside the account do we talk to? |
| Technographic | Tools and technologies in use | Salesforce + Intercom + AWS | Can our product fit, and what do we replace or plug into? |
| Intent | Research activity on a topic or category | Spike in reading about CRM migration | Is the account looking for a solution right now? |
| Behavioral | Actions toward you: visits, opens, replies | Visited the pricing page twice this week | How engaged is the account with us? |
These data types are complementary. Firmographics tell you who to target, demographics tell you who to contact, technographics tell you how to approach them, and intent and behavioral data tell you when. The firmographic attributes guide covers the first layer in detail, and the behavioral data guide the last one.
A prospect might perfectly match your firmographic criteria (right company size, right industry), but if their technographic data reveals they adopted a direct competitor just 6 months ago, it might not be the right time. Conversely, a company that's been using an outdated tool for 4 years is a prime target.
How Technographics Work: Layers and Sources
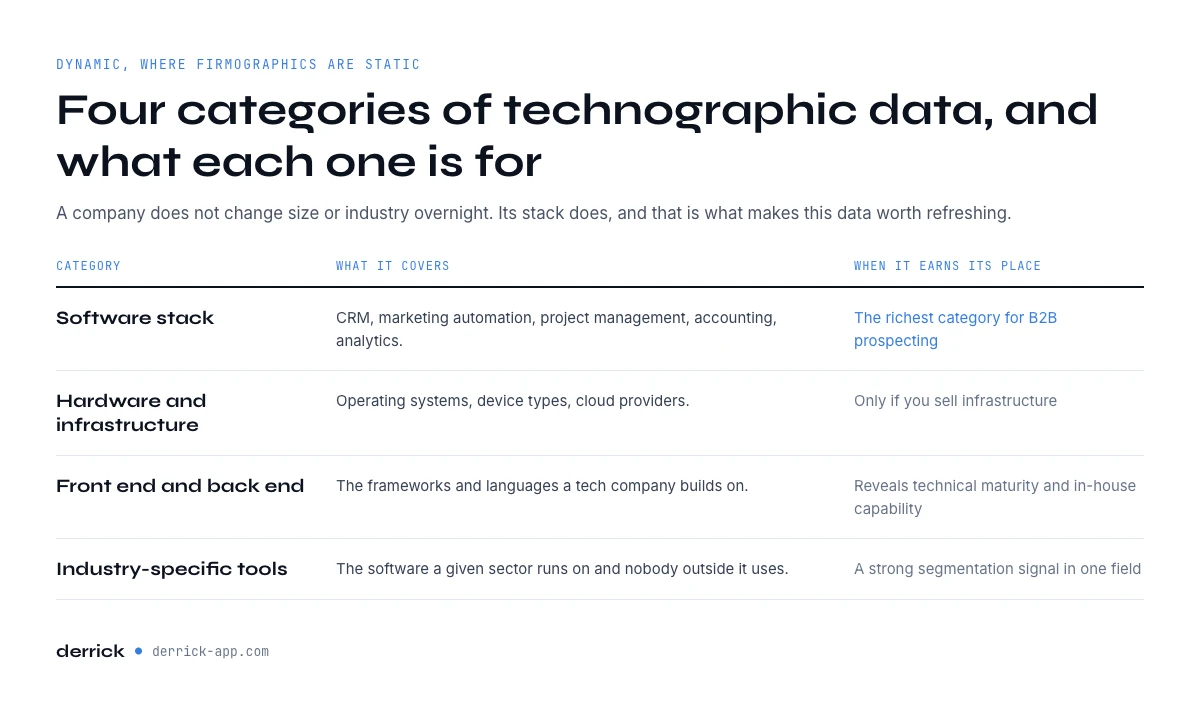
Unlike relatively static firmographic data (a company doesn't change size or industry overnight), technographic data is dynamic and evolving. Understanding how it works will help you leverage it better.
Different Types of Technographic Data
Technographic data comes in several categories, each providing specific insights:
1. Software Stack These are the applications and software the company uses: CRM, marketing automation, project management, accounting, analytics. This is typically the richest category for B2B prospecting insights.
Example for a tech scale-up: Salesforce (CRM), Marketo (marketing automation), Jira (project management), Tableau (analytics), Zendesk (customer support).
2. Hardware and Infrastructure Operating systems, device types (desktop/mobile), cloud providers. Less directly actionable for prospecting, but crucial if you're selling infrastructure solutions.
Example: Windows 10 for workstations, AWS for cloud infrastructure, iOS and Android for mobile fleet.
3. Front-end vs Back-end Tech For tech companies, knowing whether they use React or Angular on the front-end, Node.js or Python on the back-end can reveal their technical maturity and internal capabilities.
4. Industry-Specific Tools Certain industries have specific tools: Bloomberg Terminal in finance, AutoCAD in architecture, Westlaw for legal. Identifying these tools enables ultra-precise targeting.
5. Security Stack Identity providers, single sign-on, bot protection, consent management and web application firewalls. Some of it is visible from outside (a login page served by an identity provider, a consent banner script, a CDN with a firewall in front). It matters if you sell anything that has to pass a security review, because it tells you how mature that review will be.
6. AI Adoption Chat widgets built on a language model, AI search on the help center, job postings that ask for experience with LLM APIs or vector databases. A company that already ships AI features reads a pitch about AI very differently from one that has never tried. Treat this layer as a signal of appetite, not as proof of a budget.
Where Does This Data Come From?
Technographic data is collected in two ways. Active detection reads technical traces directly: the HTML and scripts a website loads, its DNS and MX records, its subdomains. Passive signals infer the stack from what people publish: job postings, employee profiles, engineering blogs, announcements. Active detection is what Website Technologies does on a public website. Passive signals are what you read by hand in steps 2 and 4 of the method below.
| Collection method | What it sees | Blind spot | Freshness |
|---|---|---|---|
| Website detection (page source, scripts, tags) | CMS, analytics, tag managers, chat, payment, front-end frameworks, CDN | Back-end, internal tools, anything not loaded on public pages | As fresh as the last scan |
| DNS and MX records | Email provider, hosting, some SaaS verified on the domain | Everything that leaves no DNS trace | Changes rarely, so stays valid longer |
| Job postings | Back-end languages, databases, cloud, data and DevOps tools | Only teams that are hiring, and wish lists mixed with real tools | Good if the posting is under 6 months old |
| Public posts and profiles | Migrations, new tools, skills of the team | Patchy coverage, depends on who posts | Dated by the post itself |
| Third-party database | Aggregated stack across many accounts at once | Method often undocumented, mix of observed and inferred | Depends on the vendor's refresh cadence |
The details of each source:
Job Postings The best source for the back-end. When a company recruits, they systematically mention the technologies candidates need to master. A "Senior Backend Developer" position mentioning "Python, Django, PostgreSQL, AWS" instantly reveals 4 stack technologies.
Advantage: Very fresh and accurate data Limitation: Only captures technologies for which the company is actively recruiting
Website Source Code Analysis By inspecting a site's HTML, CSS, and JavaScript code, you can identify front-end frameworks, analytics tools (Google Analytics, Mixpanel), tracking technologies, CDNs used, etc.
Advantage: Public and verifiable data Limitation: Only reveals client-side technologies, not back-end infrastructure
Public API Documentation Some companies publish API documentation that mentions underlying technologies or data formats used.
Public Statements Company blog, conferences, technical interviews, LinkedIn posts from employees, tech press articles. For example, if a scale-up's CTO posts on LinkedIn "Migrating from MongoDB to PostgreSQL: lessons learned," that's first-hand technographic data.
Third-Party Databases Data vendors aggregate these signals across many companies and structure them. Most attach a confidence level to each detected technology. Before you trust one, ask how that level is computed (see how to choose a technographic data provider, further down).
Why Technographic Data Transforms Your B2B Prospecting
Now that you understand what technographic data is and where it comes from, let's see concretely what it brings you day-to-day.
1. Qualify Your Leads in Seconds
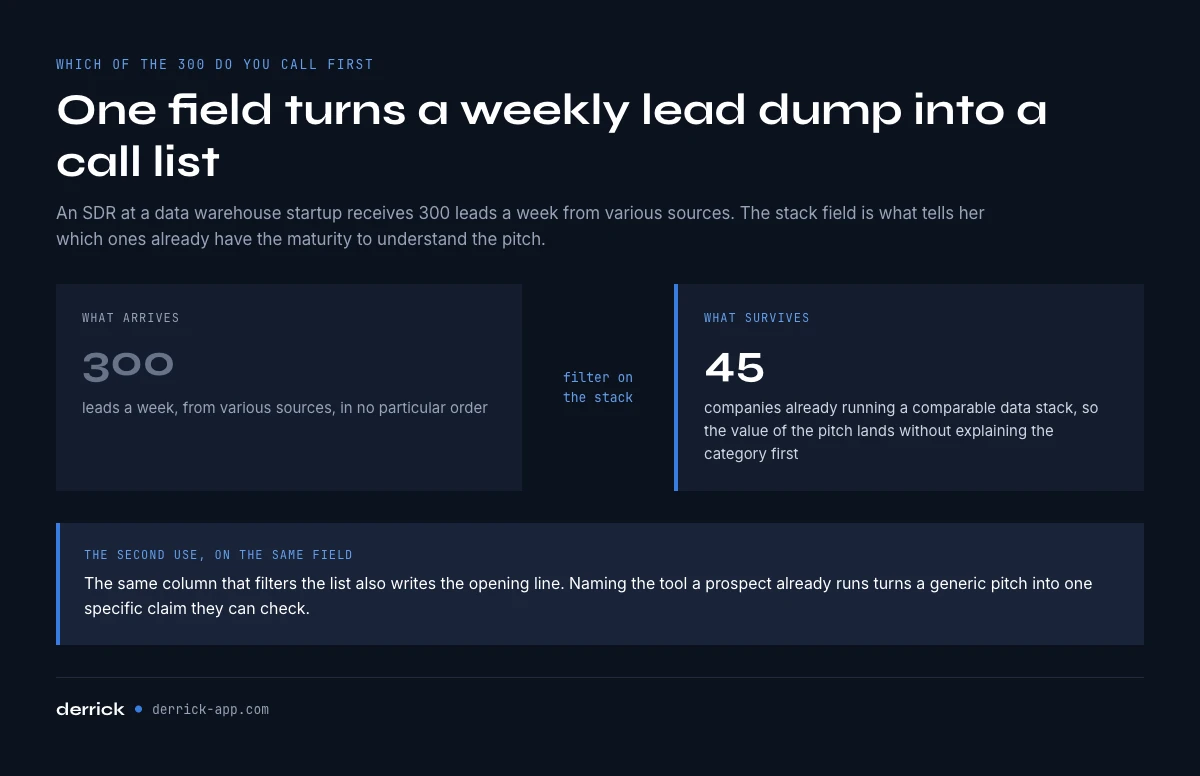
The Problem (an illustrative example): Sarah, an SDR at a data warehouse startup, receives 300 leads per week from various sources. Which ones to prioritize? Which are truly qualified?
With Technographic Data: She instantly filters to keep only companies already using Redshift, BigQuery, or Snowflake. These companies already have sufficient data maturity to understand her solution's value. In a couple of minutes, the 300 leads become a short list she can actually call.
2. Hyper-Target Your Pitch Personalization
Generic Approach: "Hi, we help companies optimize their sales process."
Approach with Technographics: "Hi Jessica, I saw your team uses Pipedrive. Our solution natively integrates with Pipedrive to automate lead scoring and predict each deal's closing probability. I can show you how three teams on the same setup use it."
The difference? In the first case, you're just another salesperson. In the second, you're an expert who understands their context and brings a concrete solution to a specific problem.
3. Identify Competitive Displacement Opportunities
The Scenario: You're selling a CRM and your main competitor is Salesforce. How do you identify companies using Salesforce AND might be open to a change?
The Method: Cross-reference technographic data + temporal data. A company that adopted Salesforce 3-4 years ago is potentially reaching contract renewal. If you also see in job postings they're recruiting a "Salesforce Administrator," that's a sign the current solution is complex to maintain, which is a perfect pain point for your pitch.
For example, an AE at a Salesforce alternative could use this approach to build a list of 200 target accounts, then work only the ones showing both signals. The numbers that come out of it are yours to measure, not ours to promise.
4. Optimize Your Outreach Timing
Technographic data doesn't just reveal which tools a company uses, but also, when you track it over time, since when. That is what makes it useful for timing.
Strong Buying Signals:
- Recent adoption of a complementary tool to yours (they're building their stack)
- Using an obsolete version for 3+ years (ready for modernization)
- Multiple tools in the same category (need for consolidation)
- Recent abandonment of a competitor (a short window while the new setup is still being decided)
Triggers you can read in the stack:
- A CRM or cloud migration: a new CRM tag on the site, a job posting for a "Salesforce to HubSpot migration lead", an engineer posting about moving off a cloud provider. Everything around the migrated tool is up for review at the same time.
- A contract renewal window: a tool detected for the first time about a year ago is often close to its first renewal. Re-scan the account a quarter before that date and see whether it is still there.
- A spike in technical hiring: five open roles naming the same database or framework means a team is being built around it, and that team will buy tooling.
- A tool disappearing: a chat or analytics script that vanished between two scans means a replacement is being chosen, or already has been.
None of these is a buying signal on its own. Two together, on an account that already fits your profile, is a reason to write this week.
How to Identify Your Prospects' Tech Stack: Step-by-Step Guide
Let's get practical now. Here's how to collect technographic data on any target company by hand, then at scale.
Step 1: Analyze Your Prospect's Website
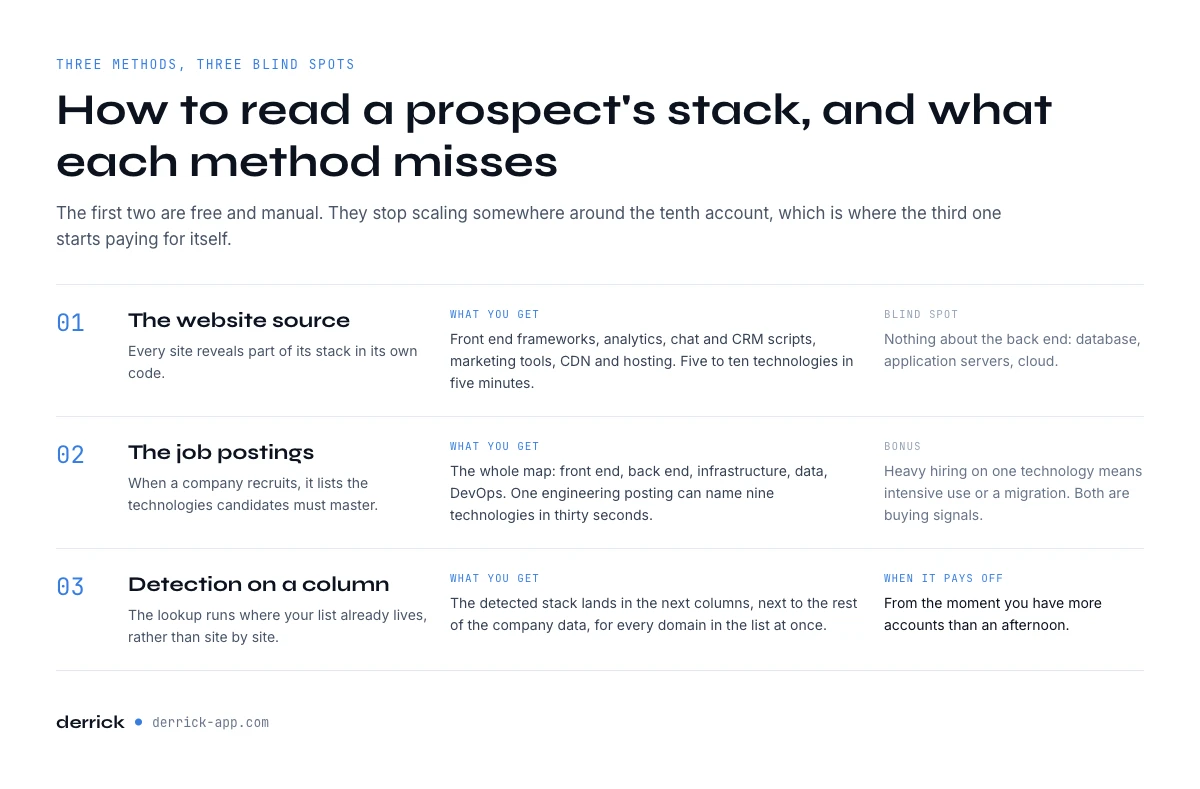
This is the simplest and most accessible method. Every website gives away part of its technographic data in its source code.
Action: Open your prospect's website, right-click > "Inspect" (or "View Source Code").
What You'll Find:
- Front-end frameworks: Look for patterns like
react,angular,vue.jsin the code - Analytics tools: Google Analytics (
gtag), Mixpanel, Amplitude - CRM/Chat: Intercom, Drift, Zendesk appear as scripts
- Marketing tools: HubSpot, Marketo, Pardot leave footprints in the code
- CDN and hosting: Cloudflare, AWS CloudFront, Fastly
Expected Result: In 5 minutes, you identify 5-10 front-end and marketing technologies.
Shortcut: our free website lookup tool scans one domain for you in the browser, with no signup and no credit spent. It is the quickest way to see what a single site runs before you decide whether to check a whole list.
Limitation: This method doesn't reveal back-end (database, application servers, cloud infrastructure). For that, move to step 2.
Step 2: Analyze the Company's Job Postings
Job postings are an underused source of technographic data. When a company recruits, they explicitly list the technologies candidates need to master.
Action: Go to the company's careers page, or search their postings on LinkedIn, Indeed, or AngelList.
What You're Looking For:
- Technical positions: "Backend Developer", "DevOps Engineer", "Data Engineer"
- "Requirements" or "Tech Stack" section: Exhaustive list of technologies
Concrete Example: A "Senior Backend Engineer" posting at a fintech in San Francisco mentions:
"Stack: Python, Django, PostgreSQL, Redis, AWS (EC2, S3, RDS), Docker, Kubernetes, CI/CD with GitLab"
You just identified 9 technologies in 30 seconds.
Expected Result: You map the entire tech stack: front-end, back-end, infrastructure, data, DevOps tools.
Bonus: If the company is heavily recruiting for a specific technology, it means they're using it intensively or migrating to it. Both are potential buying signals.
Step 3: Use Specialized Tech Stack Detection Tools
To move faster and cover multiple prospects at once, use a detection tool instead of reading source code by hand.
Browser extensions list the scripts a site loads while you visit it. They are fine for one account at a time, and stop scaling around the tenth.
How to Proceed with Derrick:
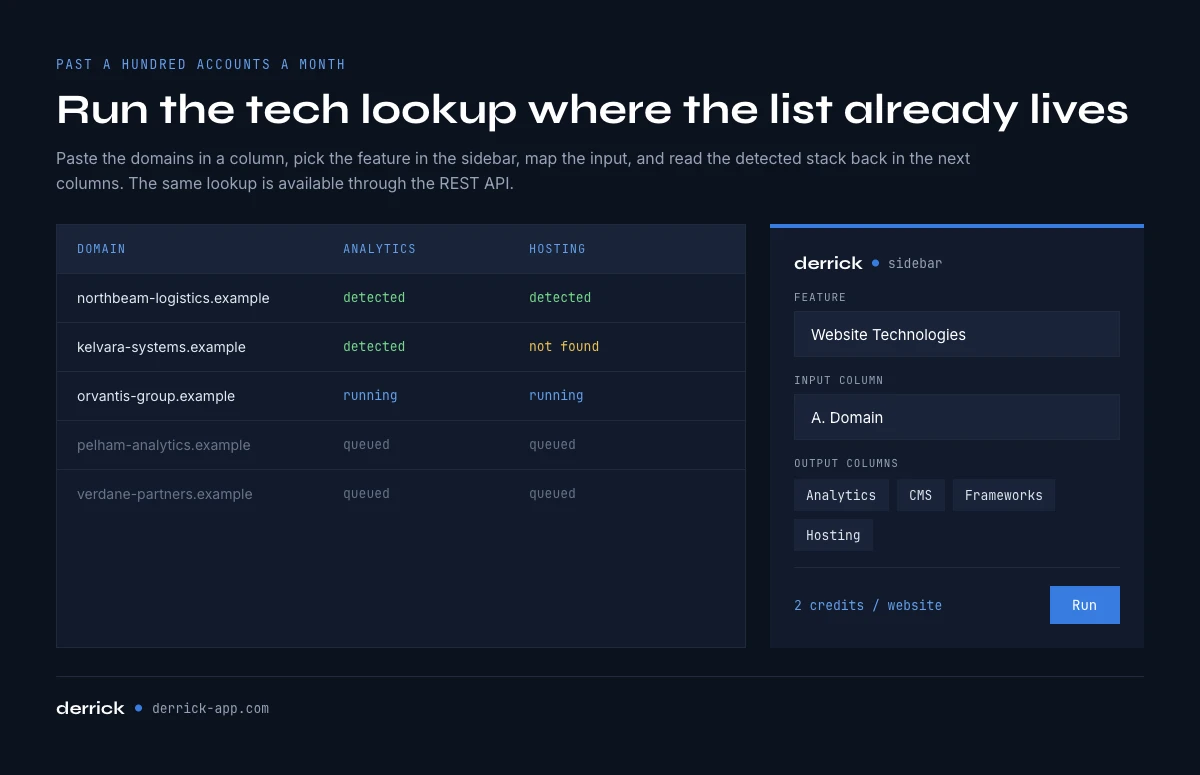
- Paste your prospects' domains in the Derrick web app (or import your account list)
- Pick Website Technologies and run it on the domain column
- Read the detected stack back in the next columns: analytics, CMS, frameworks, hosting, payment, chat
- Filter the list on the technology that matters for your pitch
It costs 2 credits per website and runs on the whole list at once, so the 50th account takes no more effort than the first. If the domains already sit in a spreadsheet, the same lookup runs from the Google Sheets sidebar. From the PLUS plan, it is also available through the REST API and the MCP server, when you would rather trigger it from your own workflow or from Claude.
Expected Result: a structured stack for every account in your list, not one report per manual visit.
Step 4: Leverage LinkedIn and Social Media
Your prospects' employees regularly share technographic data about their own company, sometimes without realizing it.
Where to Look:
- Technical posts on LinkedIn: "Excited to announce we've migrated to AWS!"
- Employee profiles: "Skills" section of developers
- Company tech blog: Articles like "How we scaled our infrastructure"
- GitHub: Some companies have public repos revealing their stack
Action: Search [company name] + tech stack or [company name] + migration on LinkedIn.
Example: Searching "Shopify tech stack" on LinkedIn, you find posts from engineers mentioning Ruby on Rails, MySQL, Redis, Kubernetes, etc.
Expected Result: Validation of identified technologies + discovery of recent migrations (buying signals).
Step 5: Cross-Reference and Validate Your Information
Like all data, quality trumps quantity. Cross-referencing sources is crucial.
A technology you are going to mention in a pitch needs a confidence level. You do not need a vendor's number for that, you need to know what goes into one:
- Recency: when was the technology last seen? A tag detected last week beats a job posting from last year.
- Agreement between sources: how many independent sources show the same tool? Website and job posting together are worth more than either alone.
- Observed or inferred: a script loaded on the site is observed. A tool named in a posting, or guessed from a similar company, is inferred. Observed wins when the two disagree.
If a technology appears in at least 2 different sources, consider it validated.
Beware of False Positives: A tool might detect a Facebook tracking pixel even if the company doesn't actively use Facebook Ads. Always contextualize.
Expected Result: A reliable list of 10-15 technologies you can confidently mention in your prospecting.
Technographic segmentation: three priority tiers
Technographic segmentation means sorting accounts by what they run, then giving each group its own priority and its own message. A tiered model keeps it simple enough that a team actually uses it.
| Tier | What the stack shows | Message | Priority |
|---|---|---|---|
| 1. Strong fit | Runs the tools you integrate with natively | "You already use X, here is what we add on top of it" | Work first |
| 2. Competitive replacement | Runs a direct competitor of yours | A precise reason to switch, timed on renewal or migration signals | Work when a trigger fires |
| 3. Greenfield | No tool in your category at all | Education: why the category exists and what it changes | Nurture |
Inside each tier, stack maturity tells you how to talk. The same segmentation by maturity works across tiers:
"Early-Stage" Segment (Basic Stack):
- Tech stack: Google Sheets, no CRM, Gmail
- Message: Educational, focus on fundamentals, quick ROI
- Tone: "Here's how you can structure your prospecting with a simple CRM"
"Growth" Segment (Stack Under Construction):
- Tech stack: HubSpot Starter, few integrations
- Message: Optimization, automation, productivity gain
- Tone: "Here's how to automate X process you're doing manually"
"Enterprise" Segment (Mature Stack):
- Tech stack: Salesforce, Marketo, Tableau, multiple integrations
- Message: Consolidation, advanced insights, enterprise features
- Tone: "Here's how our solution integrates into your existing ecosystem"
A campaign then follows the segments instead of going to everyone at once. HubSpot users get "Boost your HubSpot with our native integration", Salesforce users get "Simplify your Salesforce", and accounts with no CRM identified get "How a CRM changes your sales". Measure each segment against a generic send rather than trusting someone else's uplift figure: your list and your offer decide the result.
Weight technographic fit in your ICP score
Technographic segmentation gets sharper when the stack becomes one line of your scoring model instead of a separate filter. Give the technographic fit its own weight next to firmographic fit and intent, and let the total decide the order of your call list. How much weight it deserves depends on how hard your product depends on the prospect's tools. The guide to weight technographic fit in a lead scoring model walks through the full model.
In the web app or Google Sheets
Detect the stack from the domain
Technographic targeting stops being theoretical when the column exists. Derrick reads the website from your list and returns the technologies detected on it, so you can filter your list on the tool you integrate with or replace.
- Feature
- Website Technologies
- Credit cost
- 2 credits per call
The first button opens the web app (nothing to install): 2 credits per call, available from the STANDARD plan. The second details the feature and its cost per plan.
Using technographic data for ABM
Account-based marketing starts from a short list of accounts instead of a wide audience. Technographic data is what keeps that list honest: it removes the accounts that cannot use your product before anyone spends a week on them. A workable flow fits in four steps.
- Define the ICP by the stack. Write down the tools a good customer runs (the ones you integrate with), the ones that disqualify (an incompatible platform) and the ones that signal replacement. Look at your best current customers first: their stacks usually tell you more than any persona document.
- Build the account list and filter it. Start from your target companies, run the domains through website detection, and keep only the accounts whose stack matches. If you have one account that fits perfectly, Find Similar Companies turns it into a list of lookalikes at 1 credit per company, available on the free plan, and you run the detection on that list next.
- Split the list into tiers. Use the three technographic segmentation tiers above. Each tier gets its own sequence, its own proof points and its own owner.
- Write one message per segment. Name the tool the account runs, say what changes for them, and stop there. One technology per message is enough; the rest of the stack stays in your notes for the call.
Refresh the stack of your ABM accounts more often than the rest of the base. A tool that appears or disappears on a target account is exactly the kind of event that justifies a new touch.
Tools to Automate Tech Stack Detection on a List
If you're prospecting at scale (100+ accounts per month), collecting technographic data by hand on each prospect quickly becomes time-consuming. Here's how to automate the process.
Detect the stack on a whole list with Derrick
Derrick runs the tech lookup on your list instead of asking you to visit sites one by one.
Strengths:
- Website Technologies on a whole column of domains, row by row, in the web app
- The stack lands next to the rest of the company data, in the same list
- Same lookup available in the Google Sheets sidebar, and from the PLUS plan through the REST API and the MCP server (Claude, ChatGPT, any MCP client)
- Priced per website, not per seat or per annual contract
Use Case: an AE selling a Shopify-complementary solution pastes 500 store domains into the app, runs the lookup, and filters the rows that show Shopify plus Klaviyo but no review tool.
Pricing: 2 credits per website, on the paid plans.
No-Code Solutions: Chrome Extensions
If you prospect a moderate volume (under 50 accounts a month), a browser extension that lists the scripts a site loads can be enough. It shows trackers, analytics and tag managers on the page you are visiting. It does not export a list, does not keep history, and you redo the work every time you want a refresh.
Integrations with Derrick
Derrick offers several enrichment features that complement your technographic data:
Website Technologies analyzes a domain and returns the technologies it detects (CMS, frameworks, analytics, payment, chat). It costs 2 credits per website and runs on a paid plan. Drive it from the web app, with nothing to install, from the Google Sheets sidebar for a column of domains, from the REST API when detection belongs inside a workflow, or from the MCP server when the question is asked in Claude or another AI client.
G2 Insight retrieves customer reviews and the tooling context of a company listed on G2, at 2 credits per line on a paid plan. Useful for spotting the solutions a company is evaluating rather than the ones it already runs.
Find Similar Companies turns one account into an ICP-matched list at 1 credit per company, so a tech stack you have just qualified becomes a segment instead of a single name.
By combining these features with your technographic data, you get a fuller view of each prospect: the tools it runs, the tools it is evaluating, and the companies that look like it.
How much does technographic data cost?
With Derrick, technographic data costs 2 credits per website, whatever the surface (web app, Google Sheets, API or MCP). On STANDARD, 20 EUR a month for 10,000 credits, that is 0.004 EUR per site, or 5,000 sites a month. On SCALE, where a credit drops to 0.0016 EUR, it is 0.0032 EUR per site. Website Technologies is reserved for paid plans: the free plan (100 credits a month) is there to try the app, not to run stack detection. Most technographic data providers sell an annual contract instead, priced on volume and negotiated in a demo, so compare the price per account you actually use, not the list price.
The app works through your list row by row: 2 credits per call.
Pulling technographic data into your CRM, warehouse or AI agent (API and MCP)
A stack that lives in a one-off export goes stale in a quarter. The teams that get the most out of technographic data push it where decisions are made: the CRM record, the data warehouse, or the AI assistant the reps already talk to.
Into the CRM, at the moment a lead arrives. Call Website Technologies through the Derrick REST API when a new account is created, and write the detected tools into CRM fields. Routing rules and lead scores can then use the stack before a rep even opens the record.
Into the warehouse, in batches. Run the detection on your full account base on a schedule (quarterly for the base, monthly for the pipeline) and load the result next to your firmographic data. Comparing two runs shows which tools appeared and disappeared, which is where the timing signals come from.
Into an AI agent, on demand. With the Derrick MCP server connected to Claude, ChatGPT or another MCP client, a rep can ask "which CMS and analytics does acme.com run?" in the chat and get the answer without leaving it. Useful before a call, when you need one account, not a list.
The API and the MCP server are included from the PLUS plan (47.5 EUR a month). The price of the data does not change with the surface: 2 credits per website, by API, by MCP, in the app or in Sheets. For the setup, start from the data enrichment API page.
How to choose a technographic data provider
Every technographic data provider says its coverage is the best. You cannot verify that from a sales deck, but you can ask questions whose answers you can check on your own accounts. Run a sample of 50 domains you know well through any tool before you sign anything.
| Criterion | What to ask | Red flag |
|---|---|---|
| Accuracy and documented method | How is each technology detected? Observed on the site, or inferred? | "Proprietary AI" with no way to see why a tool was flagged |
| Coverage of your market | Are the tools that matter for your pitch detected, in your regions? | A huge technology count but your three key tools missing |
| Freshness | When was this account last scanned? Can I re-scan on demand? | No date on the result |
| Observed vs inferred | Can I tell the two apart in the output? | Every technology shown with the same confidence |
| Integration | Can I get the data in my CRM, by API, or from an AI client by MCP? | CSV export only |
| Unit price | What does one account cost, at my real volume? | Annual contract required before any test |
The cheapest test is always your own list. A provider that gets your 50 known accounts right is worth more than one with a bigger number on its homepage.
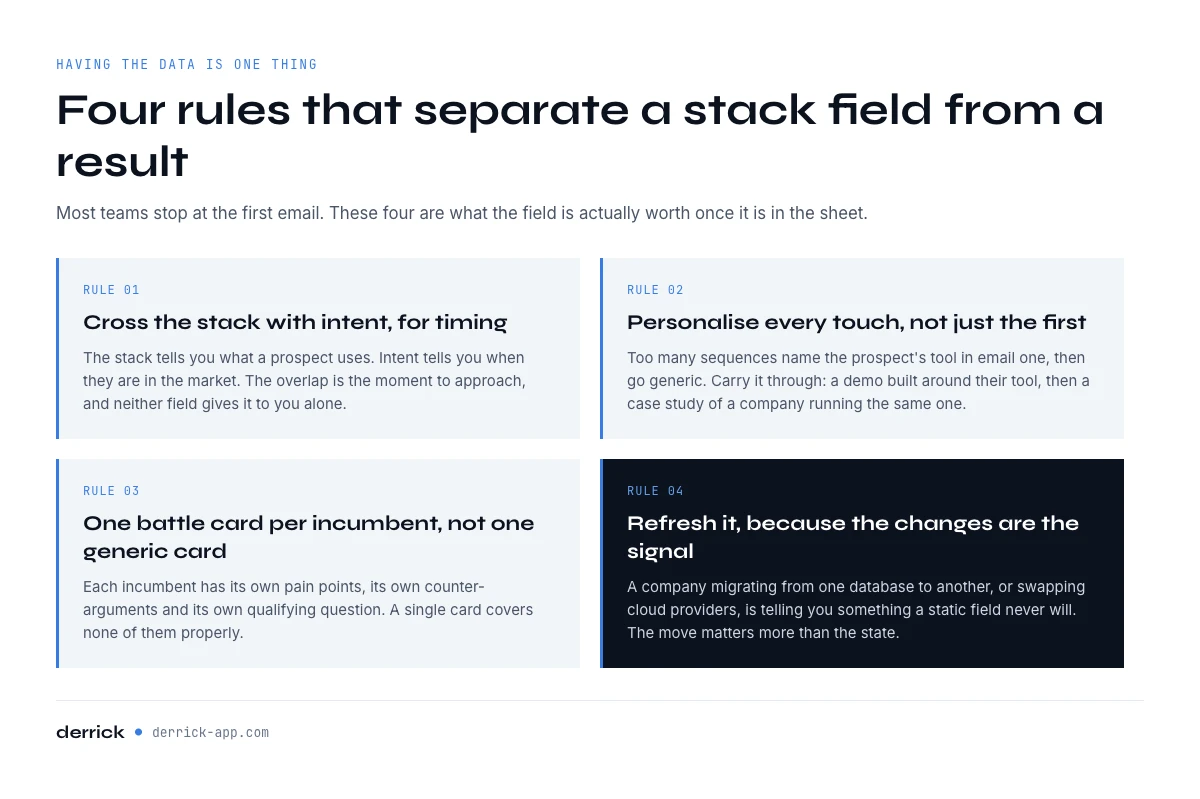
Best Practices: Golden Rules for Using Technographics in Outreach
Having access to technographic data is good. Leveraging it effectively to boost your results is better. Here are field-proven best practices.
1. Cross Technographics + Intent Data for Perfect Timing
Technographic data alone tells you what a prospect uses. Intent data tells you when they're active in the market.
Concrete Example: A prospect has been using Salesforce for 4 years (techno) + actively browsing CRM alternatives on G2 (intent) + their CTO liked 3 LinkedIn posts about "migrating from Salesforce" (social intent) = Perfect timing to approach.
Put simply: technographic data tells you about fit, intent data tells you about the moment. Fit without moment gives you a good account that is not looking. Moment without fit gives you an eager account that cannot use your product. The B2B intent data guide covers the second half.
Action: If you're using an intent-data platform, create segments that cross "uses technology X" AND "shows intent signals for category Y".
2. Personalize Every Touchpoint, Not Just the First Email
Too many sales teams only personalize their initial cold email with technographic data, then go generic mode for follow-ups.
Bad Approach:
- Email 1: "I saw you're using HubSpot…"
- Email 2 (follow-up D+3): "I wanted to make sure you saw my message…"
- Email 3 (follow-up D+7): "Last email before removing you from my list…"
Good Approach:
- Email 1: "I saw you're using HubSpot…"
- Email 2 (follow-up D+3): "I prepared a custom demo showing HubSpot integration…" [link to 2-min Loom video]
- Email 3 (follow-up D+7): "Here's a case study of a similar company using HubSpot + our solution…" [PDF link]
Result: every touch gives the prospect a new reason to answer, instead of the same reminder three times.
3. Create Competitor-Specific Battle Cards
If you're selling a CRM and your main competitors are Salesforce, HubSpot, and Pipedrive, don't create a single generic battle card. Create three, one per competitor.
"vs Salesforce" Battle Card:
- Specific pain points: Complexity, high cost, need for dedicated admin
- Arguments: Simplicity, transparent pricing, 1-week onboarding vs 3 months
- Questions to ask: "How many hours/week does your Salesforce admin spend on the platform?"
"vs HubSpot" Battle Card:
- Pain points: Sales features limitations in free version, expensive upgrade
- Arguments: Advanced sales features from starter plan
- Questions: "Which HubSpot version are you using? What limitations are you facing?"
Built on technographic data, specific battle cards arm your sales team for every situation.
4. Regularly Update Your Technographic Data
Tech stacks constantly evolve. A company can migrate from MongoDB to PostgreSQL, switch from AWS to GCP, abandon Marketo for HubSpot. These changes are major buying signals.
Recommended Update Frequency:
- Strategic accounts (top 50): Weekly
- Active pipeline (hot leads): Monthly
- Full database: Quarterly
Automation: Set up alerts on your enrichment tool to be notified when a target list account adopts a relevant new technology.
5. Keep Messaging Tied to Stack Maturity
Not all companies have the same level of technical sophistication. The early-stage, growth and enterprise segments described in the technographic segmentation section above apply to every touch, not only the first email.
6. Train Your Team to Interpret Data, Not Just Read It
Knowing a prospect uses "Python + PostgreSQL + AWS" is useless if your SDR doesn't understand what that implies.
Recommended Training:
- Level 1: What's a CRM, marketing automation, cloud provider (basic vocabulary)
- Level 2: What each technology implies for our pitch (logical connections)
- Level 3: Identify patterns (fast-scaling startup = modern stack, corporate = legacy stack)
Practical Exercise: Organize sessions where the team analyzes 5 tech stacks from existing customers and identifies common patterns among your best clients.
7. Respect GDPR Compliance and Ethical Best Practices
Technographic data is generally considered company data (not personal), but its use must remain ethical and compliant.
Best Practices:
- Only use public data or data purchased from GDPR-compliant providers
- Mention your sources if a prospect asks how you got the info
- Don't use technologies to "stalk" a prospect (e.g., "I saw you installed our competitor 2 days ago")
- Always provide opt-out option from your communications
Correct Phrasing: "I noticed on your website that you use HubSpot…" Incorrect Phrasing: "I analyzed your technical infrastructure and discovered…"
The first approach is transparent and respectful. The second can seem intrusive.
What technographic data cannot tell you
Technographic data is a strong qualifier and a weak oracle. Knowing its limits keeps your pitch accurate.
- Real usage and depth of adoption. A HubSpot script on the site does not say whether ten people live in HubSpot or one person logs in a month.
- The contract. Renewal date, price paid and number of seats are not visible from outside. A first-detection date is a hint, not a renewal date.
- Satisfaction. A company can run a tool and hate it, or love it and never replace it. Only a conversation, reviews or intent signals tell you which.
- The back-end and internal tools. Databases, internal apps and anything behind a login leave no trace on public pages. Job postings fill part of the gap.
- Who decides. The stack tells you which team owns a tool, not who signs. That is demographic data, not technographic.
That is why the method above crosses website detection with job postings and public posts, and why technographic data works best next to intent data rather than on its own.
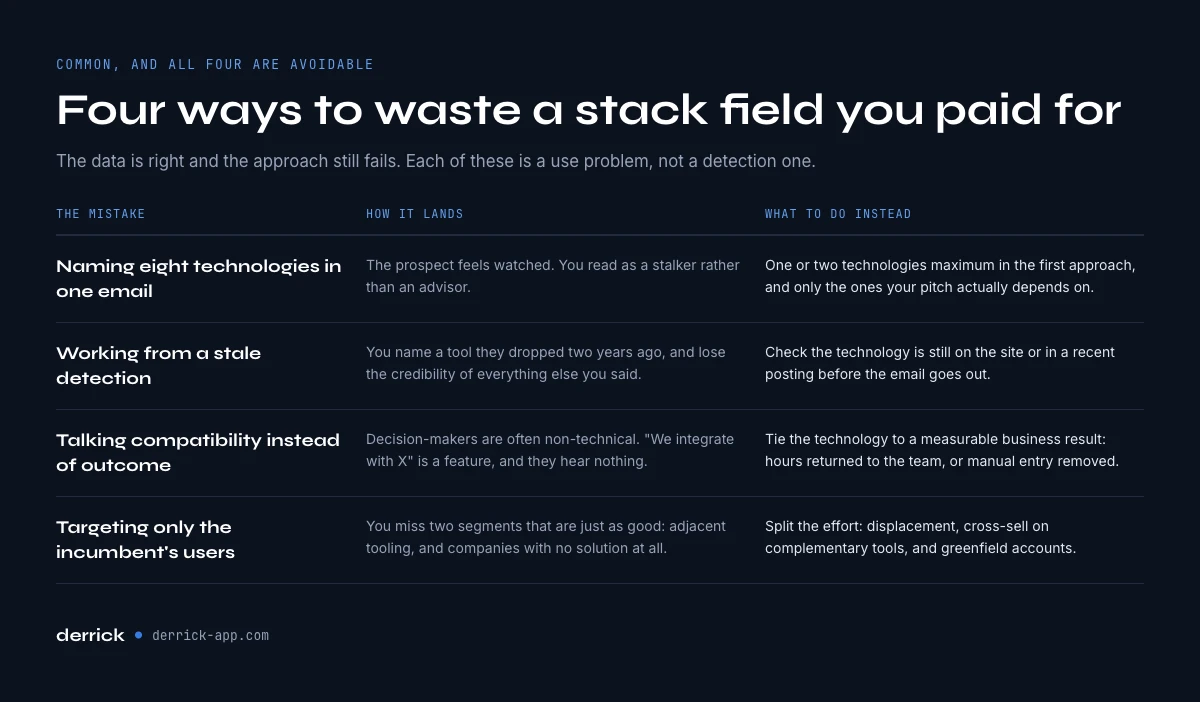
Mistakes to Avoid (And How to Fix Them)
Even with good technographic data, certain mistakes are common. Here's how to avoid them.
Problem 1: Overwhelming Your Prospect with Too Many Technical Details
Symptom: Your cold email is 300 words and mentions 8 different technologies the prospect uses.
Impact: The prospect feels surveilled, your message is indigestible, you come across as a stalker rather than an advisor.
Solution: Mention maximum 1-2 technologies in your initial approach, and only those directly relevant to your pitch.
Corrected Example: Instead of "I saw you use Salesforce, Marketo, Pardot, Google Analytics, Hotjar, Drift, Intercom, and AWS", simply say: "I noticed you use Salesforce for your CRM. Our solution natively integrates to…"
Problem 2: Relying on Outdated Data
Symptom: You mention a technology the prospect used 2 years ago but abandoned since.
Impact: You lose all credibility. The prospect thinks "They don't even know what they're talking about."
Solution: Always verify the freshness of your technographic data. Prioritize recent job postings (less than 6 months old) and real-time signals (current website source code).
Quick Check: Before sending an email, verify the technology is still present on the site or mentioned in a recent job posting.
Problem 3: Ignoring Business Context for Tech
Symptom: Your pitch is centered on "You use X, we're compatible with X" without mentioning any business benefit.
Impact: Decision-makers (often non-technical) don't see the value. You're talking features, not outcomes.
Solution: Always link technographic data to a business benefit the buyer can measure.
Bad: "Our solution integrates with your Salesforce." Good: "By integrating our solution with your Salesforce, your sales reps save 5 hours/week of manual entry, representing 20% more time for prospect calls."
Problem 4: Only Targeting Competitor Users
Symptom: You focus 100% of your prospecting on companies using your direct competitors.
Impact: You miss equally interesting opportunities: companies without a solution (greenfield) or those with adjacent solutions.
Solution: Diversify your segments:
- 40%: Competitor users (competitive displacement)
- 30%: Complementary tool users (cross-sell)
- 30%: No identified solution (greenfield)
Example: If you sell a customer success solution, target not only Gainsight users (competitor), but also companies with a mature CRM (Salesforce) but no CS tool. They have the need but not yet the solution.
Problem 5: Forgetting to Track Your Approach Results
Symptom: You prospect with tech stack-personalized messages, but don't measure if it performs better than your generic approaches.
Impact: You invest time without knowing if it's worth it. You can't optimize.
Solution: Create a simple tracking system in your CRM:
- Tag "techno-mentioned" on each prospected lead with personalization
- Compare response rate, demo rate, closing rate vs generic baseline
- Iterate based on results
Baseline: compare against your own generic sends over the same period. That is the only uplift figure that means something for your offer.
Legal and Ethical Aspects: What's Allowed, What's Not
Technographic data describes a company, not a person, and most of it comes from public sources: website code, DNS records, job postings. That makes it far less sensitive than contact data, but three habits still apply.
- Be transparent. If a prospect asks where the information comes from, say it: "we looked at the public technologies on your website and your job postings".
- Minimize. Keep the technologies you actually use for qualification and messaging, not a hundred fields per account.
- Do not mix it with personal data you have no reason to hold. The stack belongs to the company; keep it that way.
When the stack feeds an email campaign, the rules of the email itself apply. Our guide to B2B cold emailing and the rules that govern it covers that part.
Key Takeaways
- Technographic data reveals a company's complete stack (CRM, marketing tools, infrastructure) and enables ultra-targeted prospecting
- Three main collection methods: website detection, job postings, and public posts, automated on a whole list with a detection tool like Derrick
- Cross technographics + intent data for optimal timing: identify when a prospect is active in the market
- Personalize every touchpoint by mentioning the prospect's tools, not just the first email
- Technographic segmentation in three tiers (strong fit, competitive replacement, greenfield) decides who you call first
- Technographic data shows fit, not usage, contract or satisfaction: cross it with job postings and intent data
- With Derrick, detection costs 2 credits per website, from 0.004 EUR a site on STANDARD, in the app, Sheets, API or MCP
- Segment by tech stack maturity to adapt your message (early-stage, growth, enterprise)
- Update your data regularly: tech stacks evolve and these changes are major buying signals
Conclusion: Where to Start with Technographic Data
You now understand how technographic data transforms B2B prospecting. But where to start concretely?
If You're Starting Out: Begin manually. Take your 10 best existing customers and analyze their tech stack (website + job postings). Identify common patterns. Then find 50 similar prospects and approach them with a personalized message mentioning these technologies.
If You're Scaling: Run detection on your whole list with a tool like Derrick. Create tech stack segments in your CRM. Train your team to interpret data, not just read it. Measure results and iterate.
If You're Already Advanced: Cross technographics + intent data + firmographics for ultra-precise targeting. Automate enrichment via the API, or ask from Claude through MCP. Create specific playbooks per tech segment.
Stay current: the Derrick newsletter sends one email every 2 weeks with what B2B data actually says, where it breaks, and what it costs to run at volume. You can subscribe at the bottom of this page.
The key to success? Don't fall into the data paralysis trap. Start simple, test, measure, and adjust progressively. Technographic data is a means, not an end. The ultimate goal remains to better serve your prospects by bringing them a solution that naturally integrates into their existing ecosystem.
Frequently asked questions
What are technographics?
How is technographic data different from firmographic and intent data?
How do I know if technographic data is up-to-date, and how often should I refresh it?
Can I identify a company's tech stack without paid tools?
Does technographic data work for all industries?
How do I avoid seeming intrusive when mentioning a prospect's tech stack?
How much does technographic data cost?
What is an example of technographic data?
Keep reading
Continue exploring this cluster


The 20 Essential Contact Attributes to Nail Your B2B Prospecting
Read →

The 30 Essential Firmographic Attributes for B2B Targeting
Read →

B2B Demographic Data: Definition, Types & Complete Usage Guide
Read →

How to Find Company Financial Data: Revenue, Funding and Growth Signals
Read →